OHM Advisors
City of Livonia replaces paper emergency plans with shareable digital dashboards to reduce customer service disruptions
Water Distribution
Share this story
Summary
In February 2018, the City of Livonia, Michigan, experienced a master meter failure that caused several water main breaks, closed a major highway, and triggered a city-wide boil-water advisory. That experience, plus a new regulation requiring water utilities to create proactive plans for responding to system emergencies, spurred on Livonia to plan for any future such events. The city turned to OHM Advisors to create a modern digital plan using GIS-based hydraulic models that could be shared and updated with water utility engineers and operators to reduce customer impact during emergency situations.

Flooded highways in Livonia, Michigan after the city experienced a master meter failure that caused several water main breaks. Photos courtesy of OHM Advisors.
Plans for mitigating water disruptions
Service disruptions are unfortunately inevitable for all water systems, and the key to minimizing the impact of water main breaks or essential maintenance is proactive, not reactive response planning. But even proactive emergency responses can falter if steps are mapped out on pages in a binder tucked away on some bookshelf.
Even before Livonia suffered its master meter failure, the city’s 485 miles of water mains, which include 1920s-era cast-iron pipe, were showing their age. The city’s Department of Public Works (DPW) realized that a proactive emergency response plan (ERP) was vital to not only provide direction for managing and communicating incidents like the 2018 failure but also to mitigate damage to “critical users” of city water.
The October 2018 passage of the America’s Water Infrastructure Act (AWIA) was the final driver for the city’s development of a thorough and proactive ERP. Under AWIA, the U.S. Environmental Protection Agency required that water utilities complete ERPs to encourage proactive responses to water supply issues. The city of Livonia partnered with OHM Advisors, a community advancement engineering, architecture, and planning firm, to create an enhanced ERP.
Replacing fallible paper plans with rich digital scenarios
The OHM and Livonia teams came to the ERP project with several goals, including:
- Improving communication strategies targeted toward impacted residents
- Identifying the city’s critical assets to determine water disruption scenarios
- Modeling the water disruption scenarios and mitigation strategies
- Documenting the recommended operational protocols for each scenario
“Our goals focused on finding the best solution through modeling for the identified water disruption scenarios,” explains Susan Knepper, a water resources engineer at OHM Advisors. “We also wanted to plan for how the city could meet defined level of service goals, and if it couldn’t meet those goals, decide what we could recommend being done.”
Development of the Livonia ERP included the assumption that the paper-based approach was outdated, complicated to update, and difficult to share. To overcome these challenges, the team followed a workflow to create emergency and maintenance scenarios, determine the levels of service needed to minimize disruption, choose recommended operational protocols, and create the ERP.
OHM Advisors built 40+ scenarios with InfoWater Pro, a hydraulic modeling solution for clean water distribution. InfoWater Pro uses the spatial analysis tools in ArcGIS Pro from Esri to assist with model building and management. Autodesk and ESRI have a strategic partnership to provide hydraulic modeling solutions.
Knepper and her OHM colleagues used multiple scenarios to create a wide range of simulations. The scenarios were of two types:
- Emergency/unplanned scenarios, with max-day system demands (e.g., a hot summer day)
- Planned service disruption scenarios, with average-day system demands (e.g., a fall, winter, or spring day when service is generally completed)
The OHM team seamlessly displayed and shared the scenarios in ArcGIS Online to improve the water department’s understanding of the ERP process.

Interactive hydraulic performance dashboard built with InfoWater Pro and ArcGIS Pro for the city of Livonia, Michigan's emergency response plan. Image courtesy of OHM Advisors.
Setting goals for service when disruptions occur
The goals for levels of service revolved around two needs. The first was that “critical customers” would have adequate service during emergencies or planned maintenance. The second need involved all other customers receiving minimum regulatory-driven operating pressure available to them during emergencies or planned maintenance.
The identification of critical customers and their needs was an important part of the ERP planning process. Critical customers are usually healthcare facilities like hospitals. But events such as the Livonia master meter break highlighted less-obvious critical care customers whose needs had to be captured in the ERP—such as city dialysis centers and busy hotels.
“We discovered that the dialysis centers needed water pressure to be at least 40 psi so they could effectively run their filtration systems,” Knepper says, whereas the rest of the city might only need 20-35 psi depending on the scenario. “We had to get this information into a system that could be updated routinely as the needs changed.”
Integrating GIS data into scenarios
A vital part of the ERP development process was building geographic information system (GIS) layers into the final product. Livonia’s GIS data migrated seamlessly into InfoWater Pro, letting the OHM team build and update water distribution models, then present results and generate map layers using ArcGIS Pro.
“Having the GIS layers on when you’re developing scenario recommendations is really important,” Knepper says. “In models without GIS information displayed, a modeler could provide isolation recommendations where true isolation valves don’t actually exist .” By seeing the location of valves, for example, Knepper was better able to add recommendations for each scenario.
The 40-odd scenarios generated nearly 100 maps. “It was a little overwhelming,” Knepper recalls. “The volume of information prompted the suggestion that the city place the information in ArcGIS Pro dashboards.” Instead of the paper binders, Livonia DPW engineers and crisis coordinators from other city departments could quickly and easily access and use the dashboards to view scenarios, find meter locations at a glance, and review step-by-step guidelines for responding to low water pressure situations.
“With the dashboards, we created an interactive experience that the city can build on,” Knepper says. “It’s a much more user-friendly experience.”
A digital solution to age-old challenges
-
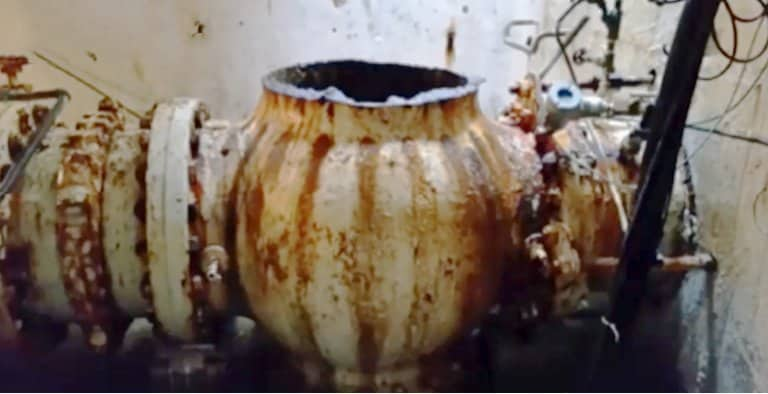
![Emergency crews isolate the source of master meter failure to a single valve]()
Pressure overload
This ancient pressure-reducing valve was the source of the problem. The city’s oldest water mains date to the 1920s and are actively being replaced.
-
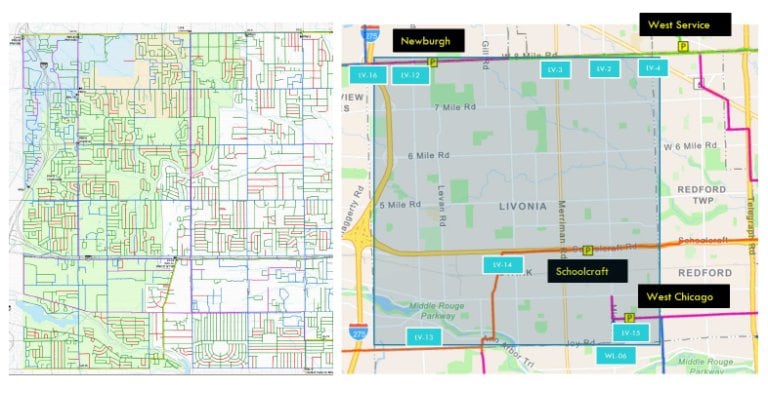
![Maps showing the city of Livonia, Michigan water systems]()
Controlling downstream flows
Livonia’s 485 miles of water mains (left) need pressure-reducing valves to accommodate eight Great Lakes Water Authority master meter feeds (right).
-
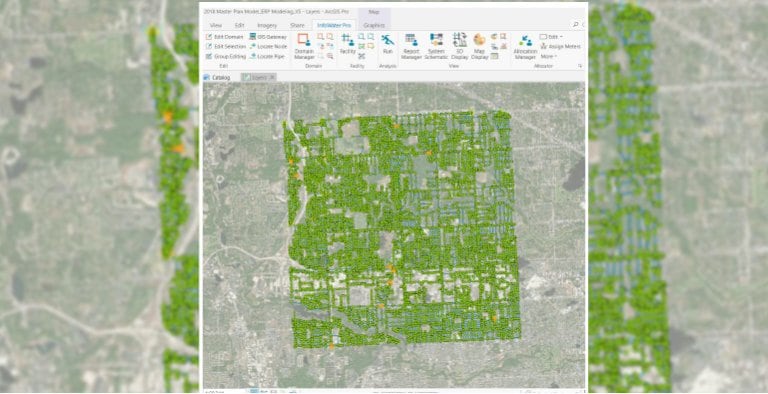
![Digital hydraulic model for water distribution with InfoWater Pro]()
The model that guides them
OHM Advisors’ InfoWater Pro hydraulic model is the bedrock of Livonia’s ERP, which ties together capital planning, permitting, pressure control, fire protection, system optimization, ISO, and emergency response scenarios.
An emergency response plan that grows with the DPW
With scenarios and ERPs developed, OHM and Livonia were ready to guide responders in efficiently carrying out ERPs in response to corresponding scenarios. Throughout the development of the ERPs, Knepper looked for small ways to increase user-friendliness, like connecting with the city operators to ask them their opinions on the layout and format of data. “We wanted inexperienced operators to be comfortable using the scenarios and the steps.” In addition, she ensured that the model files were organized effectively, clearly labeling model-generated data sets with the name of the associated scenario so whenever anyone hopped into the model, they would immediately be able to associate the data set with the appropriate scenario.
The ease of use also extended to communicating with critical customers and local citizens. The ArcGIS Pro dashboards included contact information for healthcare facilities and other locations whose special water pressure needs were detailed in each scenario. By clicking on the contact information stored in InfoWater Pro, a template email is automatically generated that the city can send to their critical customers with details about an emergency or planned maintenance event. Since the documentation is digital and not paper-based, Livonia DPW operators can also share knowledge that might not otherwise be captured.
“People leave and they take their knowledge with them. With a model-based emergency response plan, we can capture information that could be critical to a future event, like knowing that turning off a certain water main wouldn’t disrupt residents. That’s important institutional knowledge we can continue to share.”
—Susan Knepper, Water Resources Engineer, OHM Advisors
Related content
Explore more inspiring stories of water innovation achieved with digital technology.