Any referenced datasets can be downloaded from "Module downloads" in the module overview.
Extract reports, evaluate, and choose - Exercise
Task 1: Create different proposals using the same TSA and determine which one pollutes less
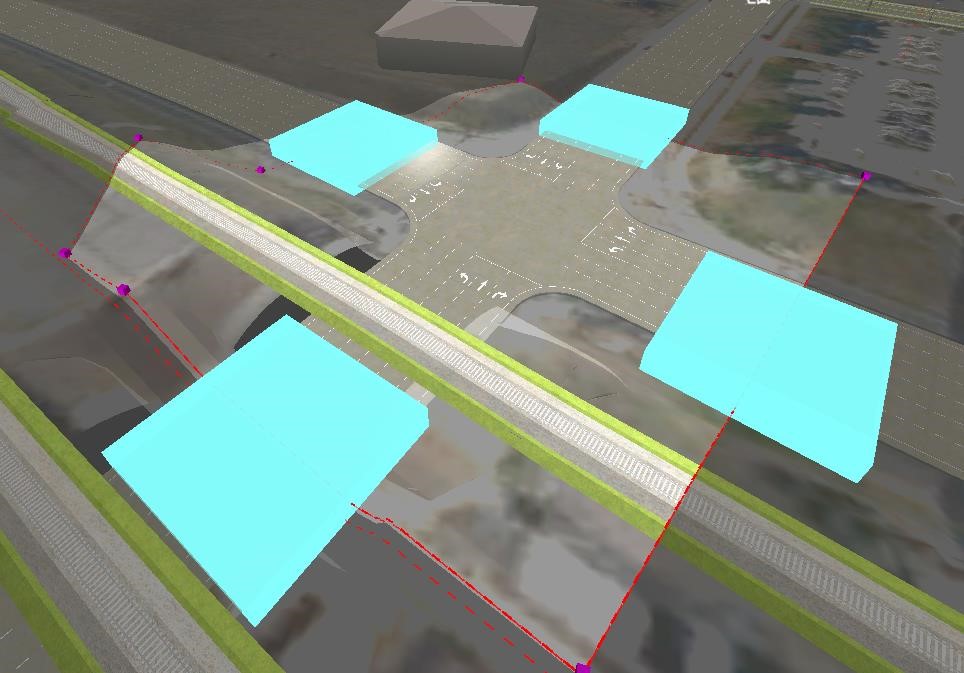
Create a TSA, ideally with a minimum of 5 demand zones (crossing 5 component roads).
Go to Tap and under Demands, edit the demand matrix to overload, Categories E or F, and the Levels of Service (red bars) is the network you have created within the TSA.
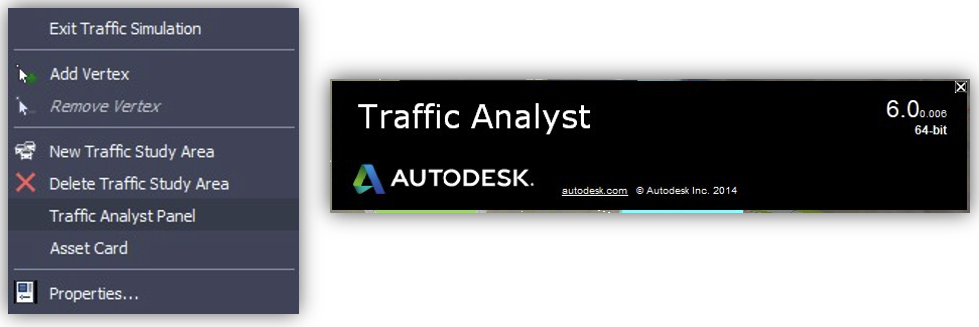
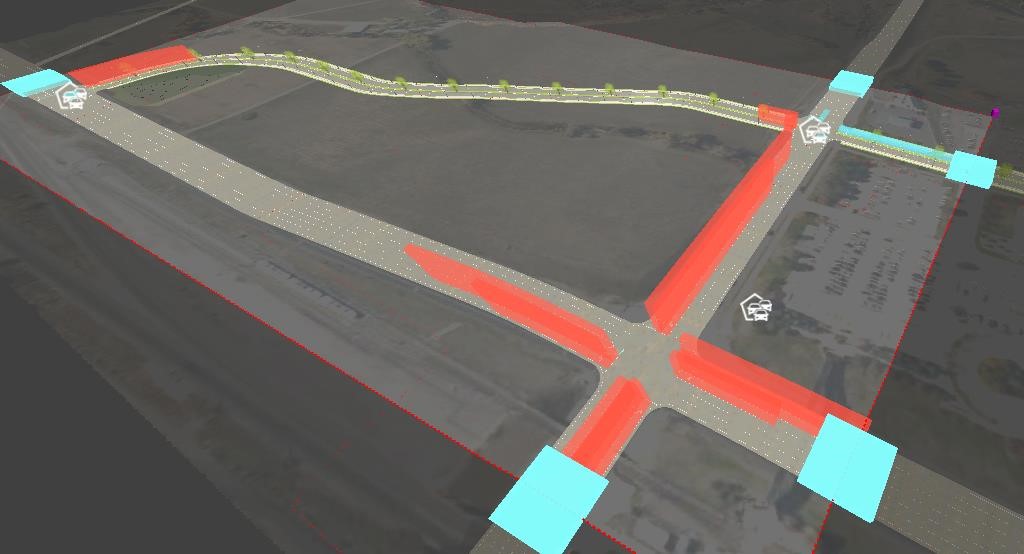
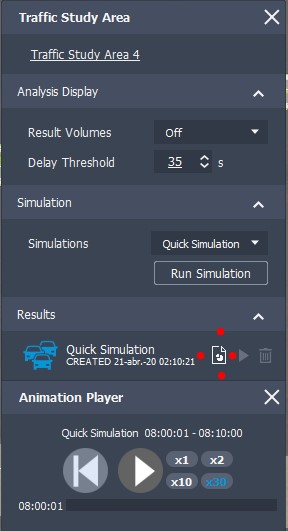
Go to InfraWorks, run the simulation, and ensure that your network is overloaded (red bars on Per Approach/within the asset card or traffic simulation preview window).
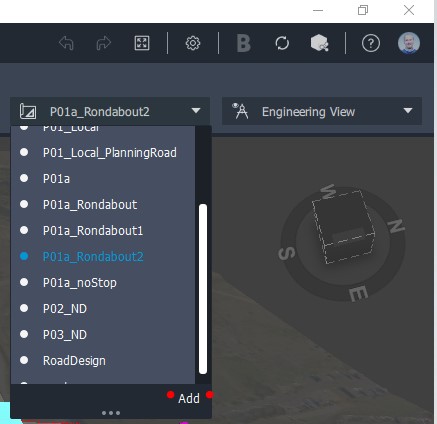
Create new proposals based on the model you have created the TSA for by clicking Add on the proposals drop-down menu.
Run the same simulation, i.e. Long Morning, in all the proposals with the same TSA.
Select the report button to download one report for each proposal made. Focus on the NAME OF SIMULATION-VehicleTrips-08-10-00.000.xls file.
Go to the ResultsVehicleDetail Excel tab, SUM the last 3 columns, and Save.
Repeat the last 3 points for each proposal.
Compare the results with the other proposals and determine which network proposal is the most polluted one.