Step-by-step Guide
InfoWorks WS Pro allows you to include multiple scenarios in a hydraulic run, and then compare their performance during the simulation by graphing their results simultaneously.
First, commit any changes to your current model:
- Right-click the BridgeNet network and select Commit changes to database.

- In the Commit change to server dialog box, click OK.
- Repeat Steps 1 and 2 for the BridgeCon
Note: Committing these changes to the database only overwrites the currently active scenario.
To create a new run with multiple scenarios:
- in the Model Group window, right-click Run Group, then select New > Run.

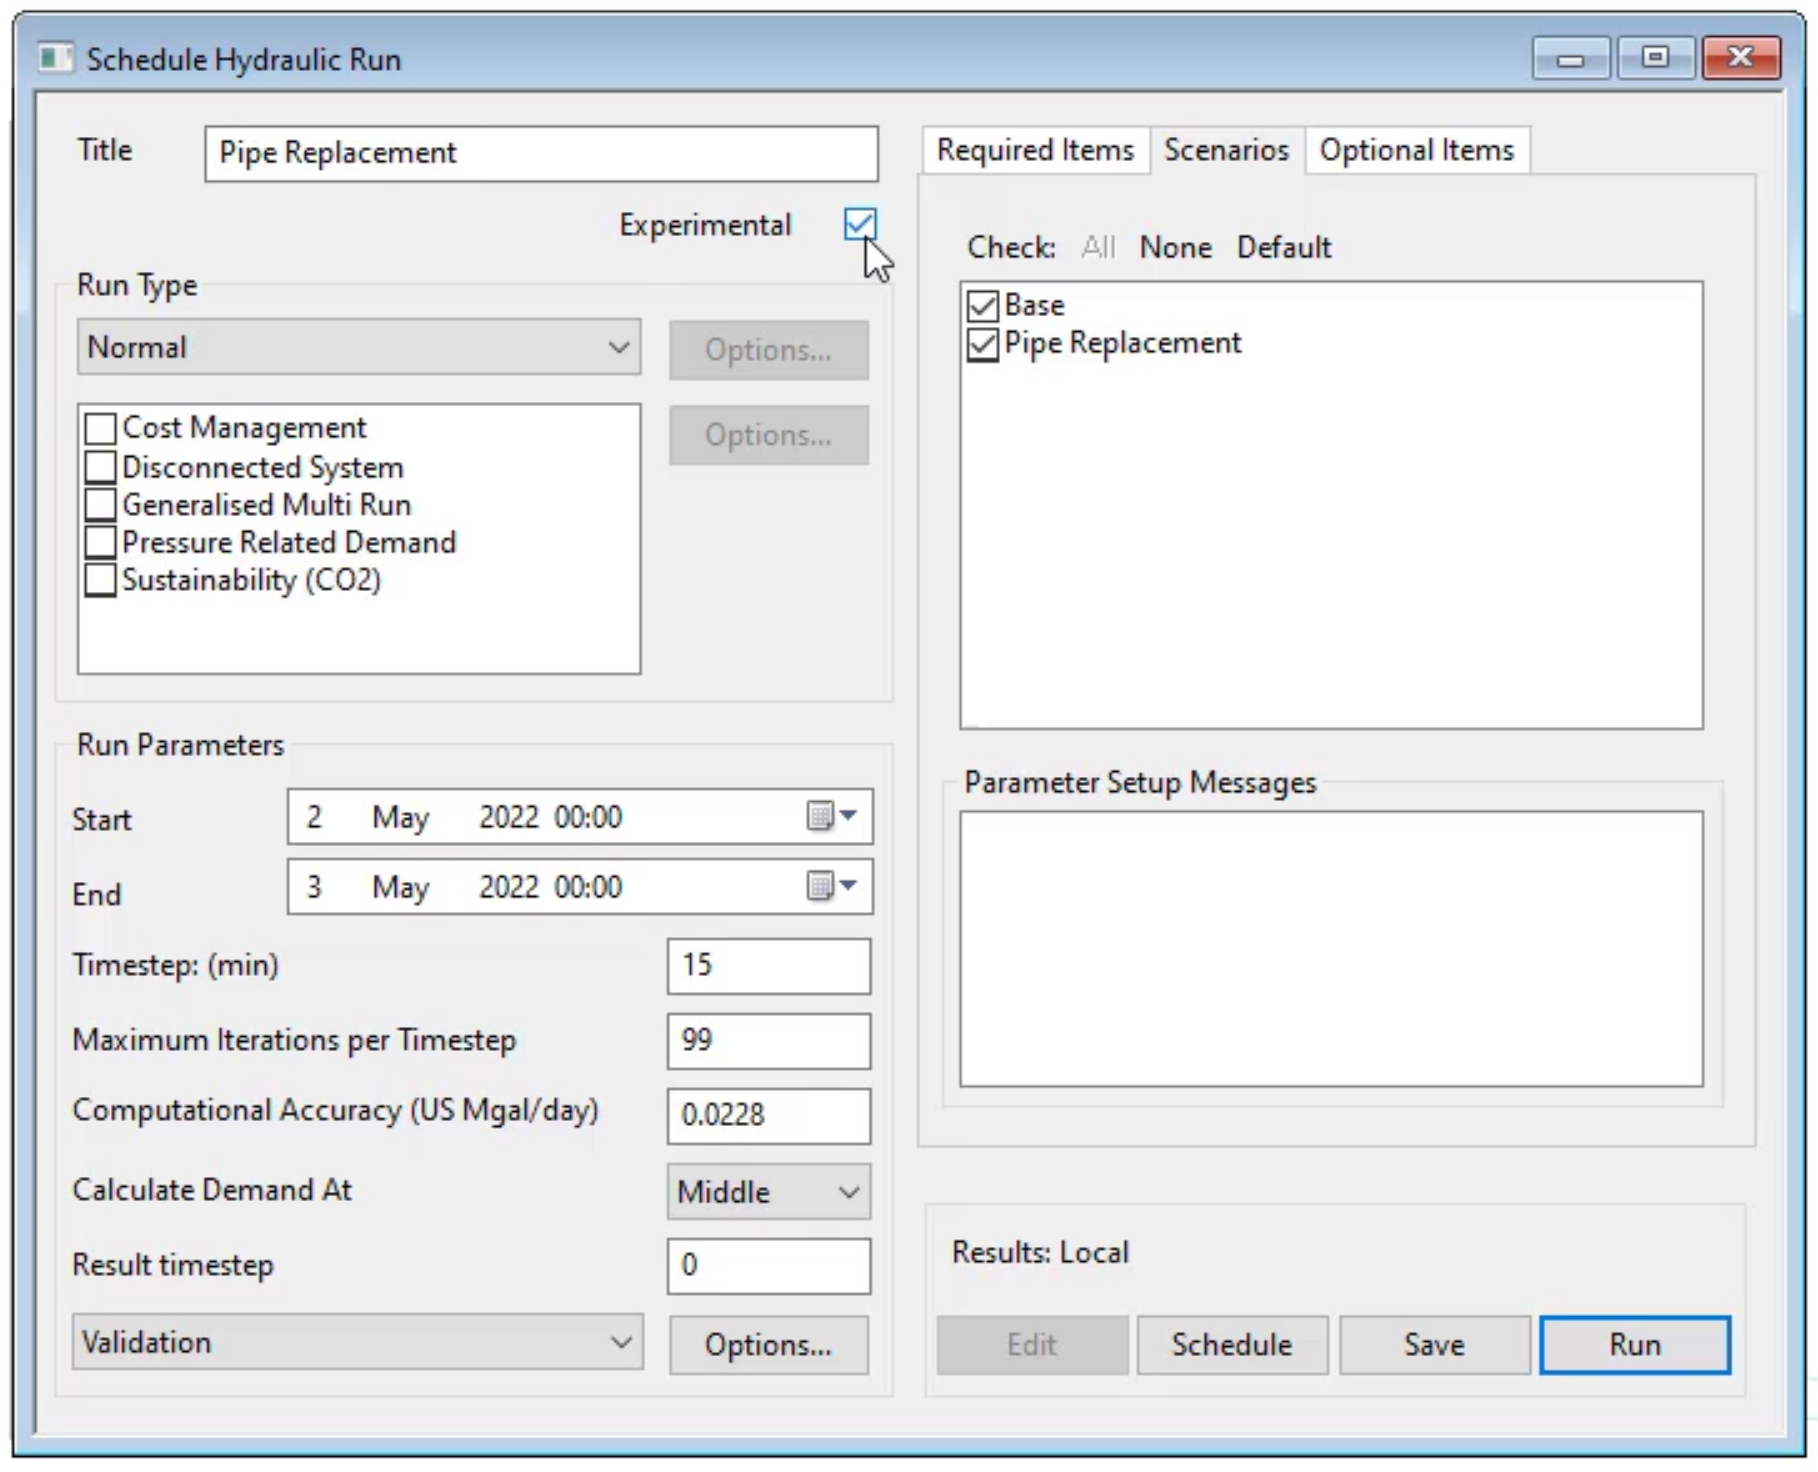
- In the Schedule Hydraulic Run dialog box, in the Title field, enter “Pipe Replacement”.
- From the Model Group window, click and drag the BridgeNet network into the Schedule Hydraulic Run dialog box and drop it into the Network group box.
Notice that the Control and Demand Diagram group boxes populate automatically.

- Above the Network box, open the Scenarios
- Select the box next to Pipe Replacement.
Note: This example includes the Base scenario, as it can be convenient to have the run results for both packaged together.
- Select Experimental.
- Click Save.
- Click Run.
- In the notification dialog box, click Yes to continue.
Note: In the Model Group window, under Pipe Replacement, the icons next to the scenarios turn green, indicating you can view their results.
- Drag-and-drop the BridgeCon or (Pipe Replacement) BridgeCon scenario into an empty part of the GeoPlan workspace to view its results.

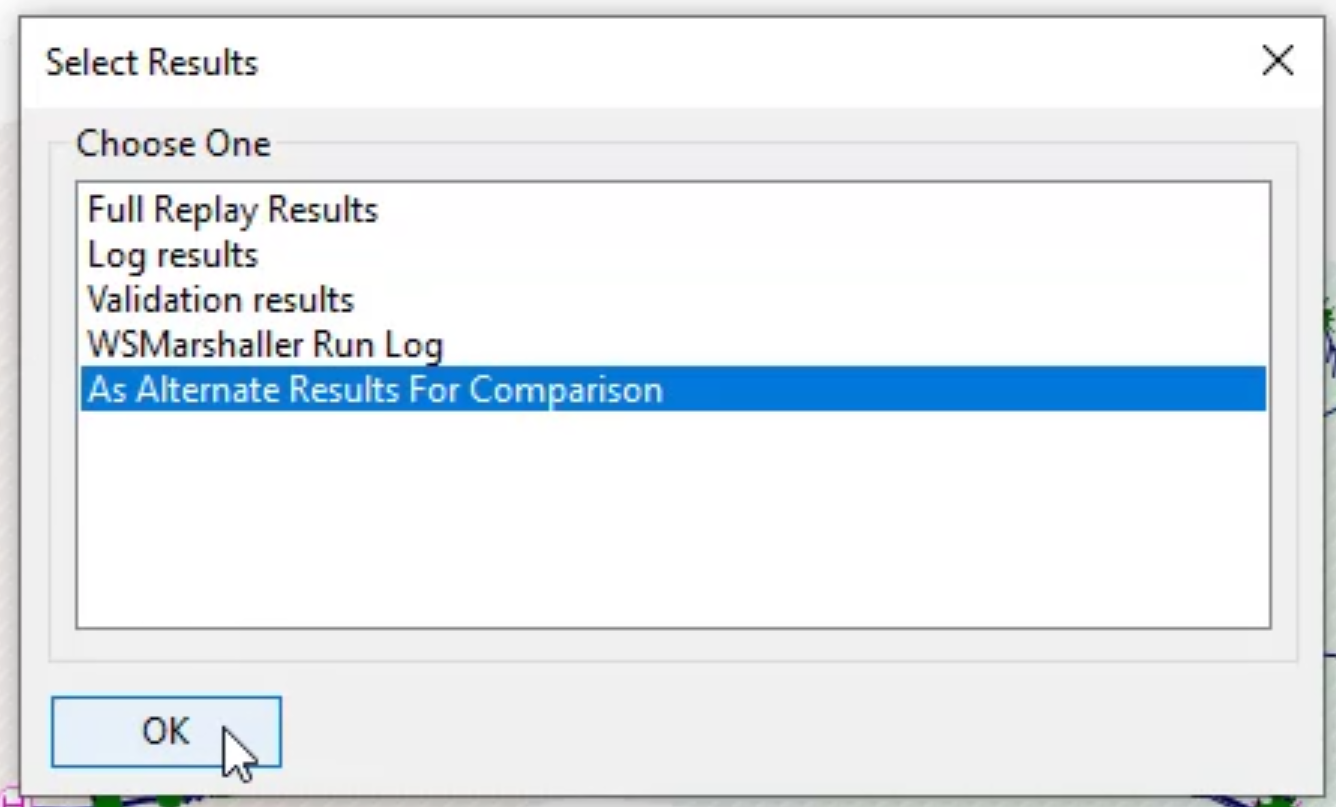
- In the Model Group window, under the Pipe Replacement run, right-click BridgeCon and select Open as.

- In the Select Results dialog box, in the Choose One list, select As Alternate Results For Comparison.
- Click OK.
- In the Tools toolbar, click Graph.

- In the results GeoPlan window, zoom in and click a section of pipe.
- In the Select what to graph dialog box, select Flow.
- Select Graph alternate results.
- Click OK.

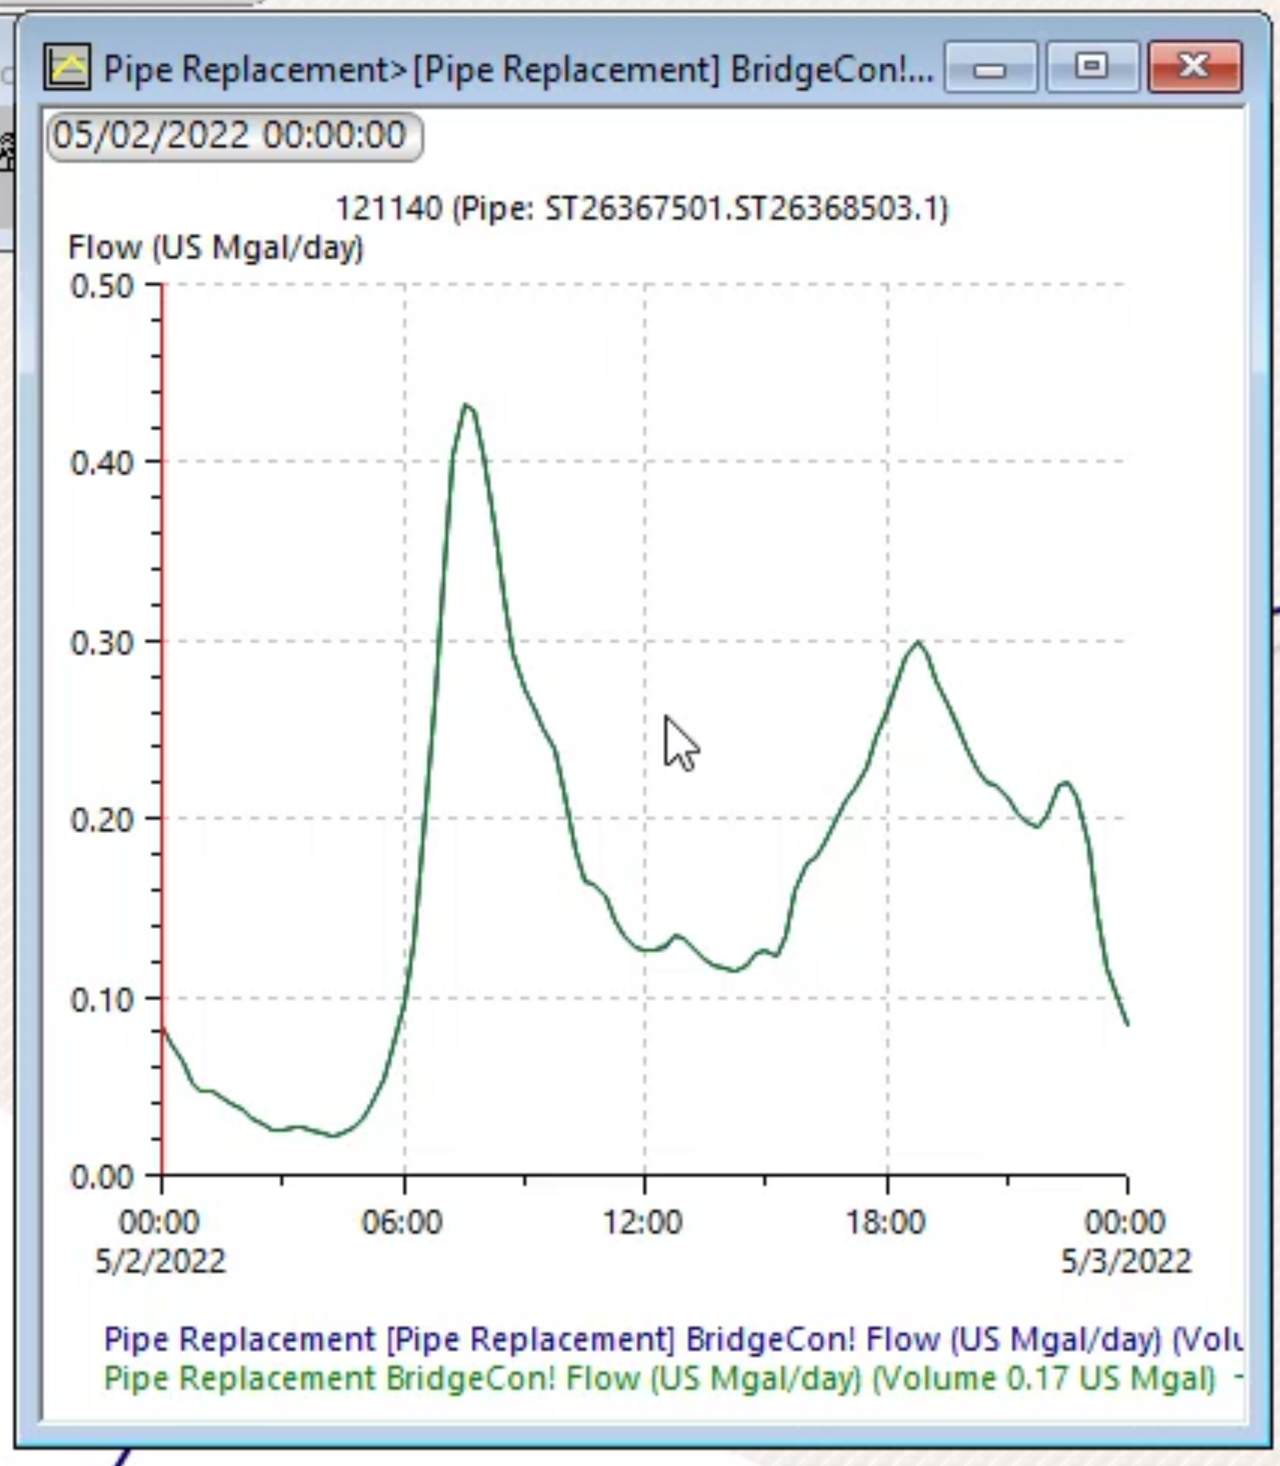
- In the graph window, review the results showing the flow rates of both pipes in the two different scenarios.
Note: In this example, there is little noticeable difference between the two scenarios, as their graph lines largely overlap. If there were significant differences, you would need to adjust variables like flow rate or friction coefficient to compensate.
- Close the graph window and the results window.


