00:03
InfoWorks WS Pro’s critical link analysis, or CLA, run type
00:08
allows automated testing and reporting of the effects of failure of a selection of links.
00:13
First, you define the time of outage and method of failure for the selected links.
00:18
Then, a simulation is run either for each selected link, or for each isolation area in the selection, in turn.
00:25
It is best practice to start with a base run.
00:28
This is optional, but recommended so that you can familiarize yourself with the model,
00:33
ensure the model does not have any validation errors before you begin the CLA,
00:37
and, if it is a new model, be able to make comparisons with the CLA run.
00:42
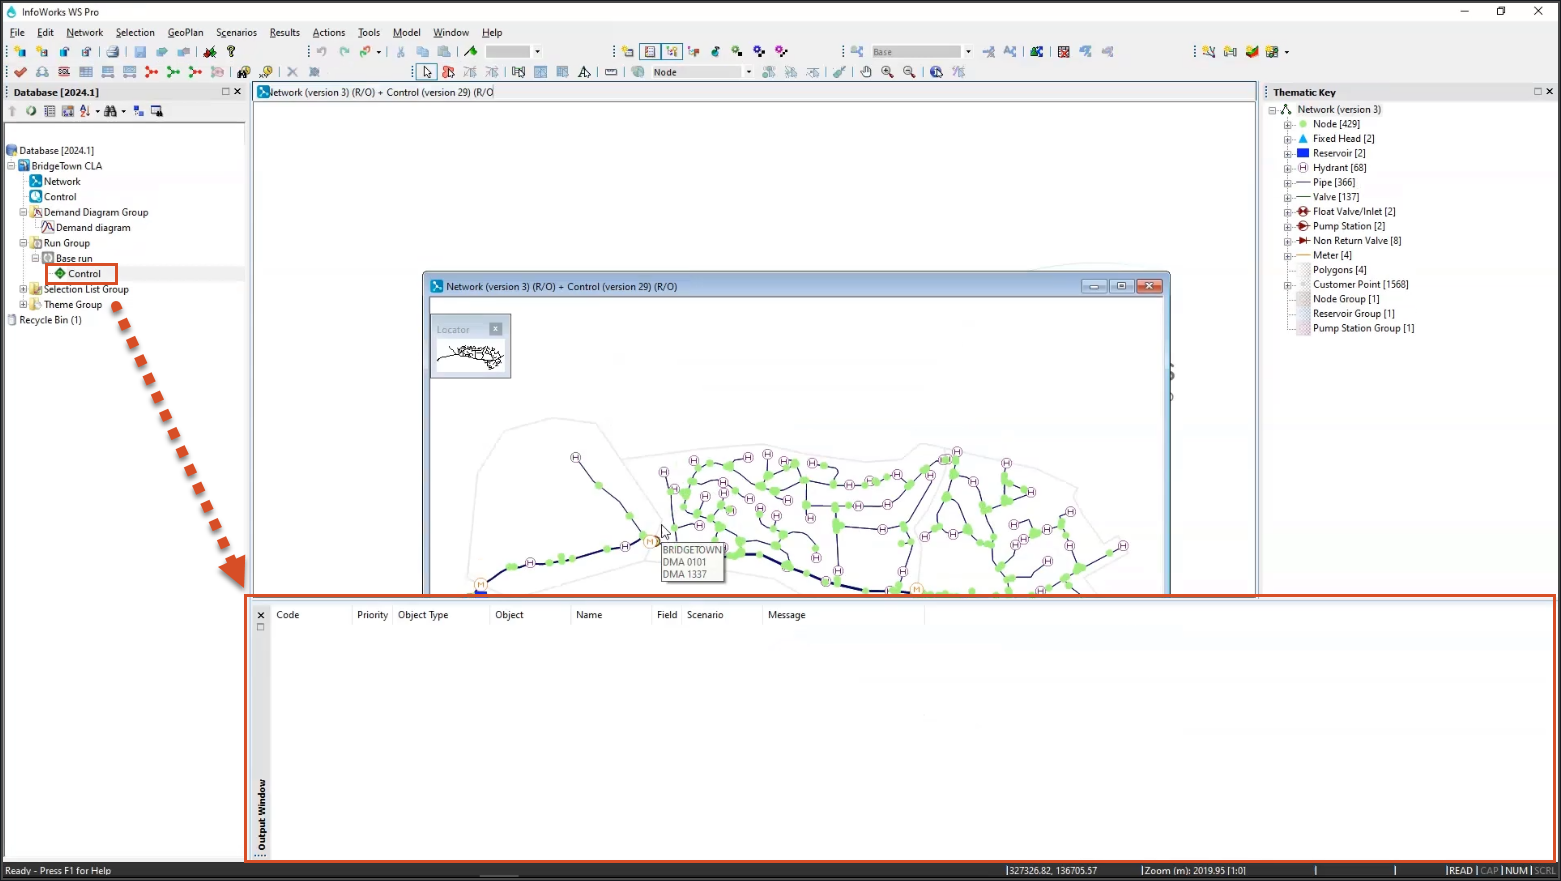
In the Model Group window, right-click Run Group and select New > Run.
00:48
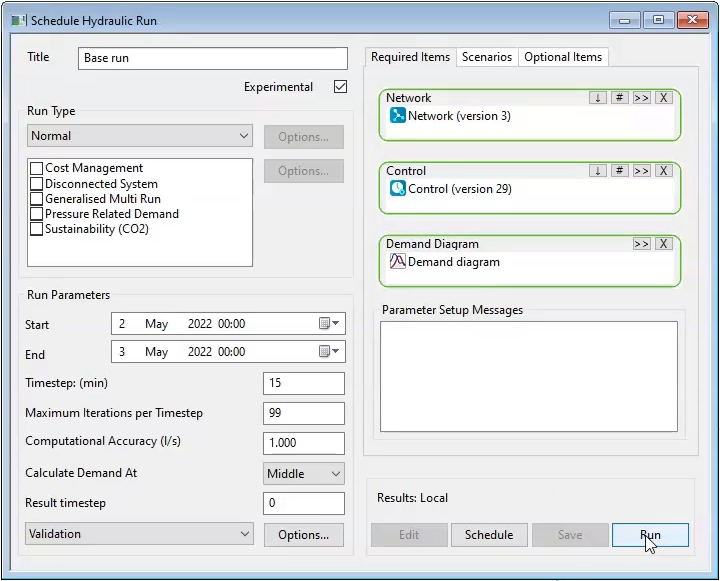
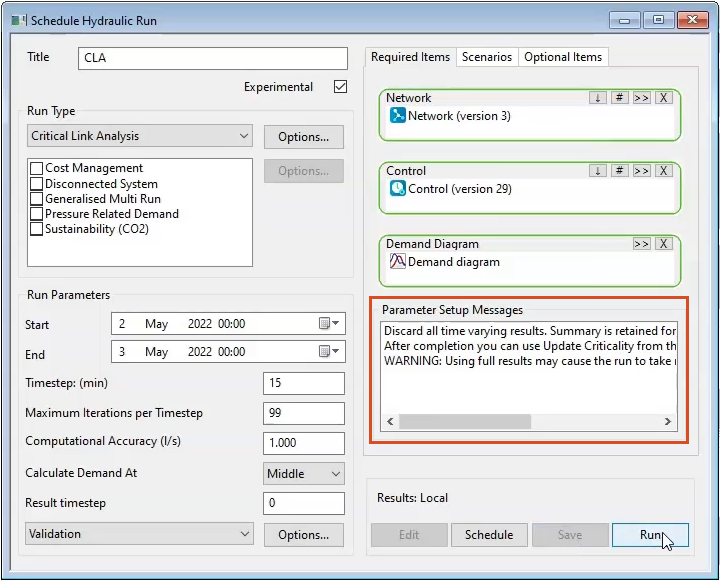
In the Schedule Hydraulic Run dialog, type “Base run” into the Title field, and then enable Experimental.
00:55
You can check the validity of the baseline by right-clicking on Control simulation, clicking Open As… and selecting Validation Results.
01:05
No errors or warnings in the Output window means your model is suitable to perform a CLA.
01:12
Next, from the Model Group, drag and drop the Network, Control, and Demand diagram into their respective panes in the dialog.
01:23
Then, in the Run Parameters group box, adjust the Start date and time to May 2nd, 2022 at midnight.
01:31
Change the End date and time to May 3rd, 2022 at midnight.
01:36
Leave all other values in the Run Parameters group box unchanged.
01:41
Click Save, and then Run.
01:44
Be aware that the more links you include in a CLA run, the longer the simulation will take.
01:50
You can find the exact number of pipes in the entire network by clicking the Network menu and picking Network overview,
01:57
which lists the total number of objects by type in the network.
02:01
To create the CLA run, right-click Run Group and select New > Run.
02:07
In the Schedule Hydraulic Run dialog, enter “CLA” in the Title field, and then enable Experimental.
02:14
Then, drag and drop the same network, control, and demand diagram as were used for the base run.
02:20
In the Run Parameters group box, adjust the Start time to May 2nd, 2022 and the End time to May 3rd, 2022.
02:30
In the Run Type group box, expand the drop-down menu and select Critical Link Analysis.
02:36
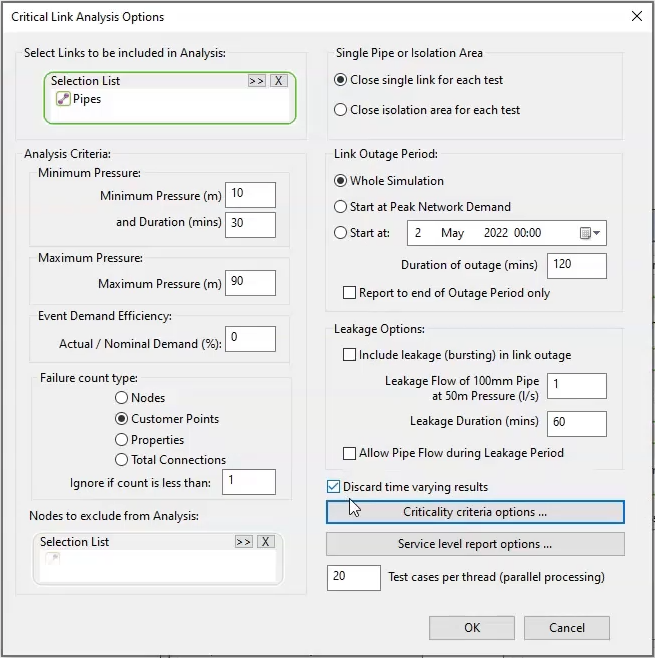
This opens the Critical Link Analysis Options dialog.
02:40
From the Model Group, drag the Pipes selection list and drop it into the Selection List pane.
02:46
Note the values in the Minimum Pressure group box.
02:49
In this example, the minimum pressure is set to 10, and the duration is set to 30 minutes.
02:55
This means that, in the event of a service interruption such as a pipe break or closure,
02:60
a pressure drop below 10 meters for longer than 30 minutes is considered a failure.
03:05
In the Failure count type: group box, enable Customer Points.
03:11
In the Single Pipe or Isolation Area group box,
03:14
you select whether a single link or a group of links in an isolation area is to be closed for analysis.
03:20
Enabling Close single link for each test means that each link included in the selection list is closed and simulated one at a time.
03:29
Enabling Close isolation area for each test means that for each isolation Area Code found in the selection list,
03:36
all links in the isolation area will be closed and simulated at once.
03:41
There will be one simulation run per isolation area.
03:45
Note that you can check the box next to Discard time varying results, which can be beneficial when working on larger models.
03:52
Check this box so that the CLA will only generate a summary report and criticality values.
03:59
Next, click Criticality criteria options… to open the Criticality Criteria grid.
04:04
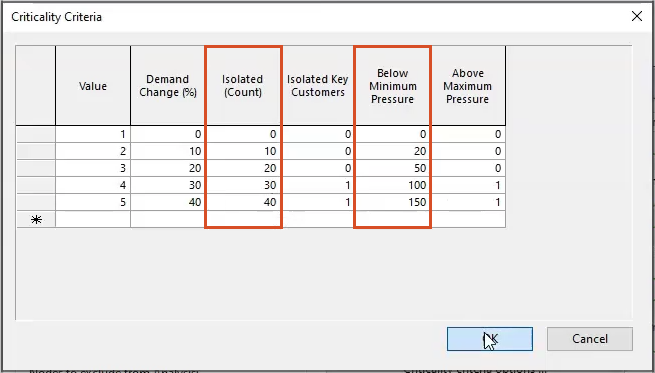
You can edit this grid to adjust the criticality criteria.
04:08
In this example, because you are working on only a small part of a network with roughly 3,500 customer points,
04:15
some of the default values can be lowered to reflect a smaller number of customers.
04:20
Adjust the values in the Below Minimum Pressure column to the following, starting in the first row:
04:32
In the Isolated (Count) column, change the values to 0, 10, 20, 30, and 40.
04:40
Note the Isolated Key Customers column.
04:43
You can specify key customers, such as hospitals or emergency services,
04:47
so that if a service interruption impacts them, it will automatically receive a high criticality value.
04:54
Leave the default values in this column, then click OK.
04:58
Click OK again in the Critical Link Analysis Options dialog to close it.
05:03
Back in the Schedule Hydraulic Run dialog, click Save and then Run.
05:08
A notification will appear, informing you of how many simulations the CLA will run, and that it may take a long time.
05:16
Click Yes to continue.