Step-by-step guide
When viewing the output results of a UDF simulation in InfoWater Pro, there are several ways to customize the appearance of map elements.
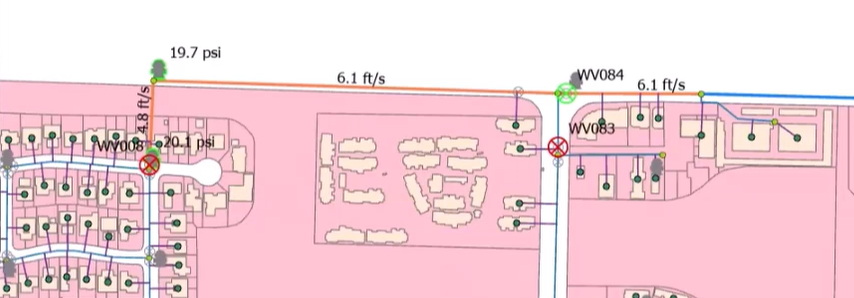
For example, in the following image, pipes in the currently active sequence are highlighted in orange, and previously flushed pipes are highlighted in blue. Valves that need to be open or closed are circled in green and red, respectively, and hydrants that need to be open are highlighted in green.
Additionally, pipes are annotated with velocities, and hydrants are labeled with their respective residual pressures.
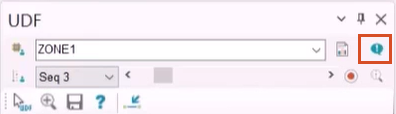
From the Model Explorer, UDF tab, there are several options for navigating results and notifying customers.
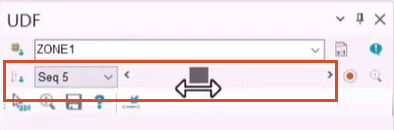
To update the map and visible data with a different sequence:
- Use the sequence slider or current sequence ID drop-down to select a new sequence.
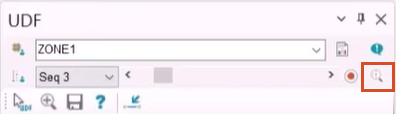
To zoom to the active sequence on the map:
- Click Zoom to Active Sequence.
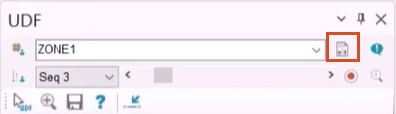
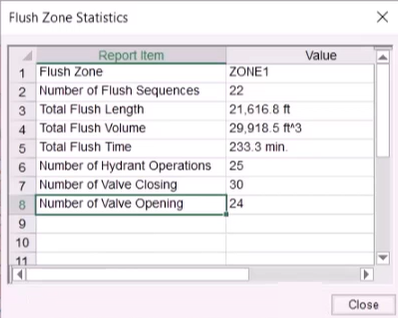
To view a table of report items from a sequence:
- Click Flush Zone Statistics.
In the Flush Zone Statistics dialog box, view report information about the current flush zone, including the number of sequences, total length of pipe flushed, flush volume, number of hydrants, and the number of valve operations involved.
To locate properties within the currently active layer that will be directly or indirectly impacted by a flushing operation:
- Click Notify Affected Customers.
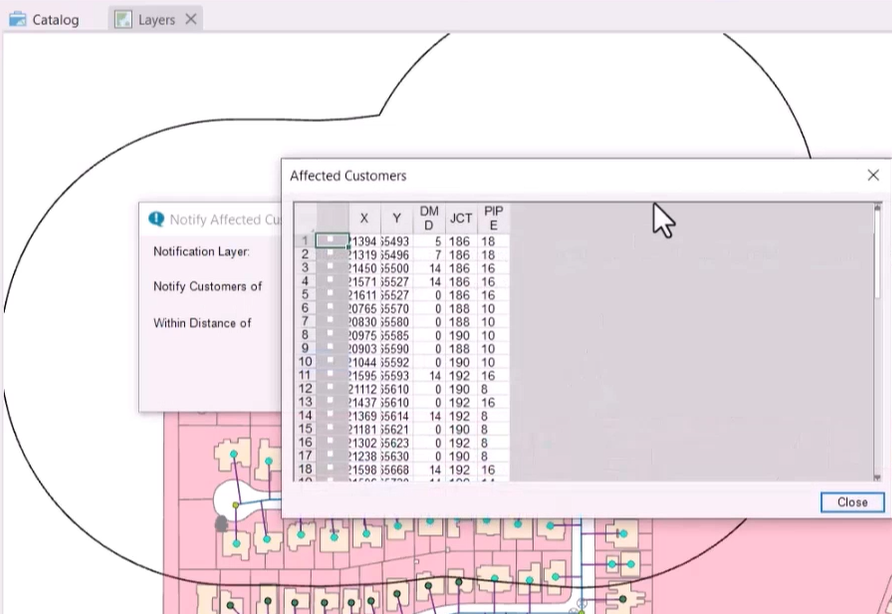
- In the Notify Affected Customers dialog box, select customers from a GIS layer spatially, within a set distance of an active flush zone or sequence.
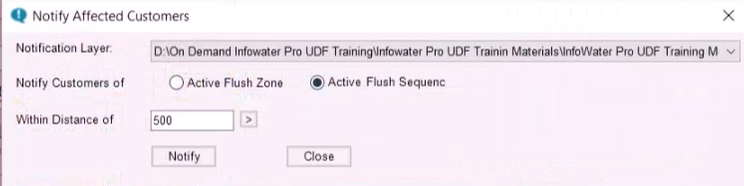
- Click Notify to generate a list of customers to contact and view the notification layer on the map.
Additional UDF results options are available from the InfoWater Pro ribbon, UDF panel.
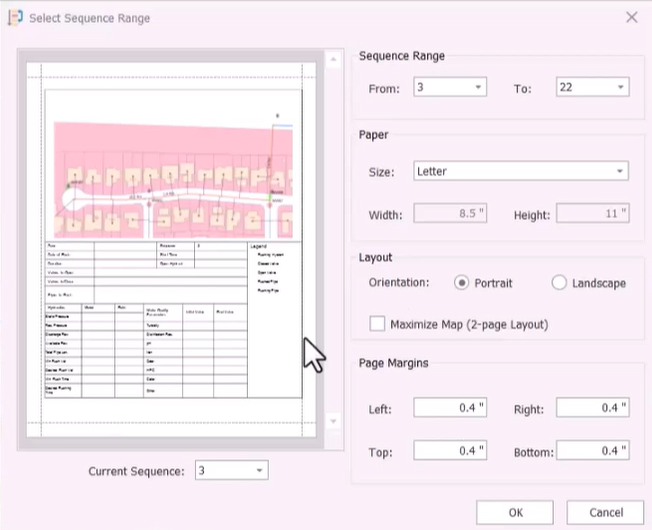
To obtain a printable field journal:
- In the More drop-down, select Print Field Journal.
The field journal, also called a “flush book”, contains a series of graphical maps and technical data sheets to guide field personnel in implementing developed UDF sequences.
To highlight each zone with a custom color:
- From the More drop-down, pick Color Code Flushing Zone
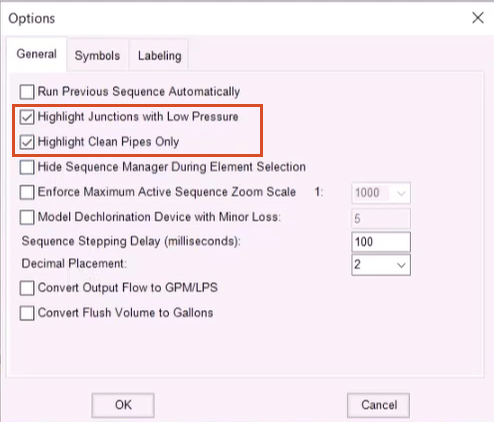
To customize the appearance of certain map elements:
- Select More > Options to open the Options dialog box:
- Switch to the General tab to enable various UDF settings, such as highlighting junctions with low pressure and clean pipes.
- Select the Symbols tab to customize the colors of symbols within the map.
- Use the Labeling tab to label data elements within an active sequence with IDs or output results.


