Step-by-step guide
Themes allow for displaying particular parameters graphically on the GeoPlan window and are a powerful way to display simulation results visually. In this tutorial, you set up some themes to make viewing the model easier, and to present some basic simulation results.
To complete this exercise, copy the data out of the transportable database .icmt file for this tutorial.
Results themes are built in the same way that object properties fields are used, but when a set of results is open, the results fields for that simulation become active.
Note: A results theme can only be edited using an active set of results, and the set of results should be appropriate for the theme being generated.
To create a theme to display simulation results:
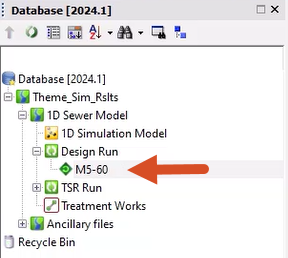
- In the Model Group, double-click the Design Run simulation to open the results in a GeoPlan window.
- Right-click the GeoPlan and select Properties & Themes to open the GeoPlan Properties and Themes dialog box.
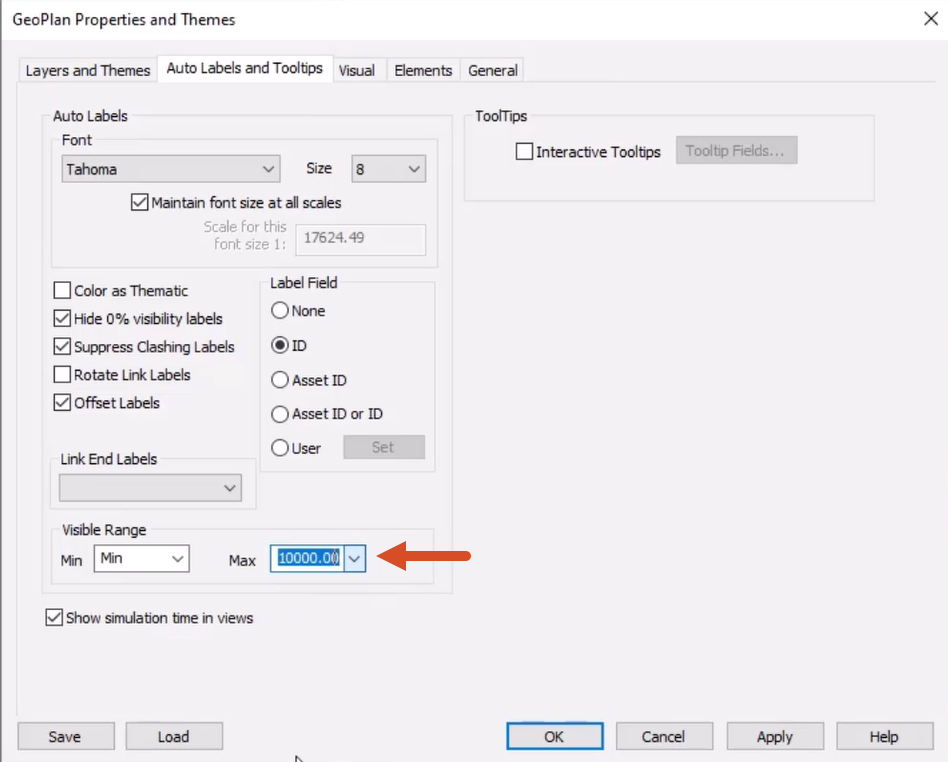
- To help view the results theme, on the Auto Labels and Tooltips tab, in the Visible Range section, set the Max to 10000.00.
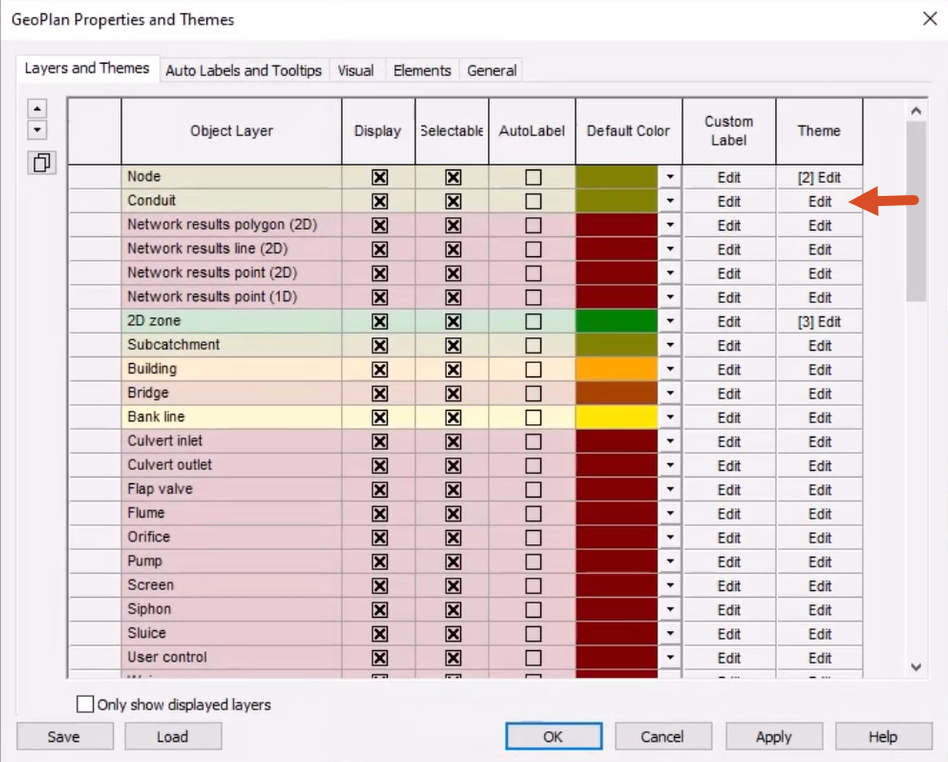
- On the Layers and Themes tab, in the Conduit row, click Edit.
- In the Layer Theme Editor, click Add New.
For this theme, simple raw results data are used to identify conduits that are surcharged.
- In the Name field, enter "Surcharge".
- In the Field drop-down, select sim.Surcharge (Surcharge state).
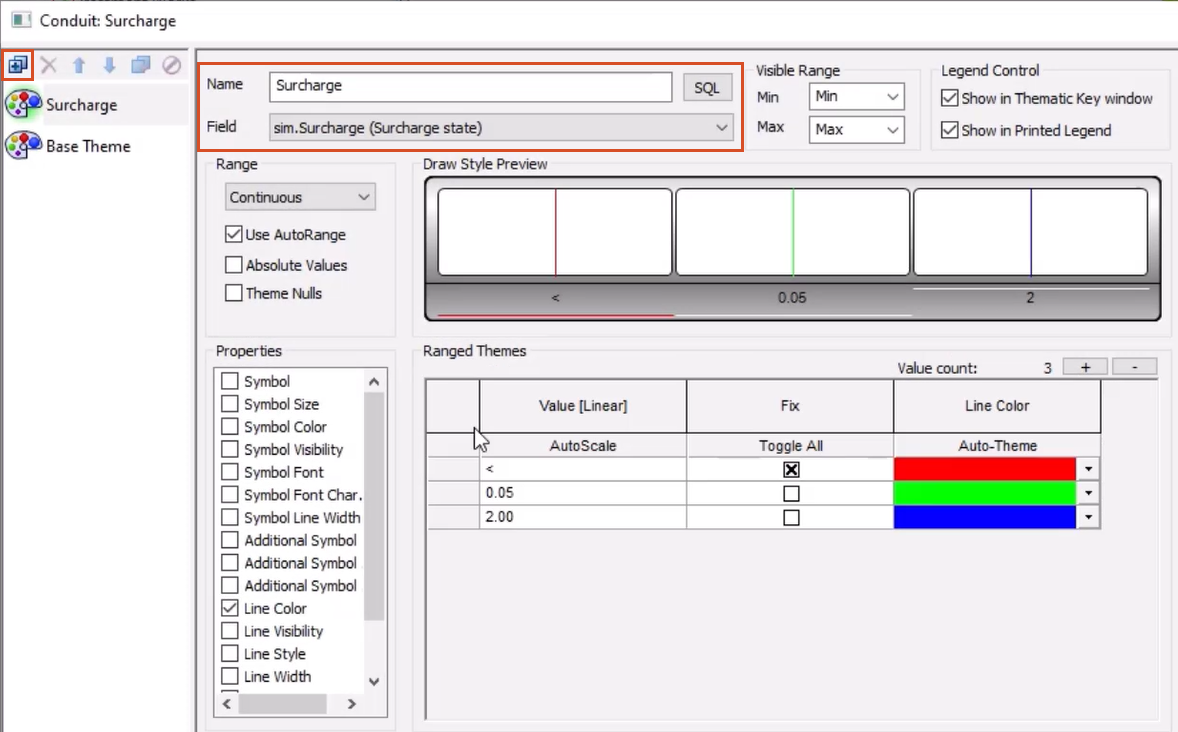
The data is auto-populated into the Ranged Themes section. To change the display of this data:
- In the Properties list, leave Line Color enabled, and select Line Width and Ignore.
- Under Ranged Themes, set up the rows as follows:
- Row 1: Enable Ignore
- Row 2: Value 1.00, Fix toggled, Line Colour Light Blue, Line Width 2
- Row 3: Value 2.00, Fix untoggled, Line Colour Hot Pink, Line Width 2
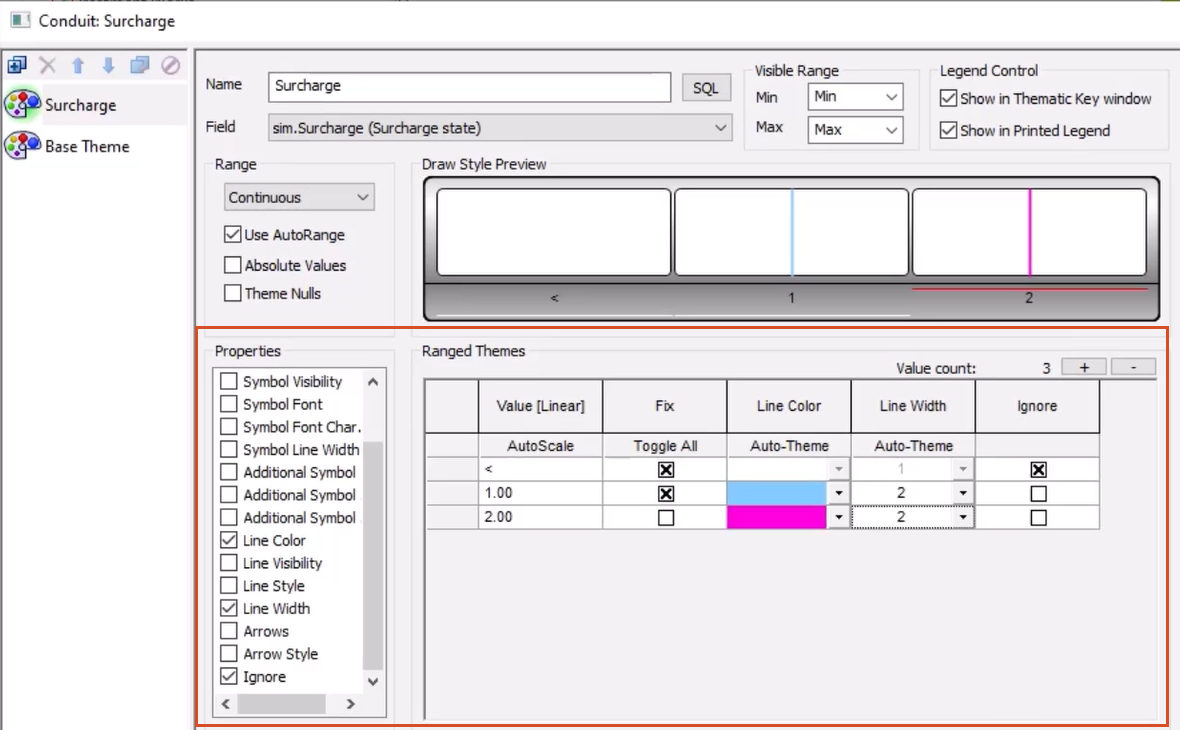
- Click Apply.
- Click OK to return to the GeoPlan Properties and Themes dialog box.
- To make it easier to view the results, in the Subcatchment row, disable Display.
- Click Apply.
- Click OK to close the Properties and Themes dialog box.
- Use the Replay Control toolbar to play through the simulation and see the surcharge theme applied to the conduit links.
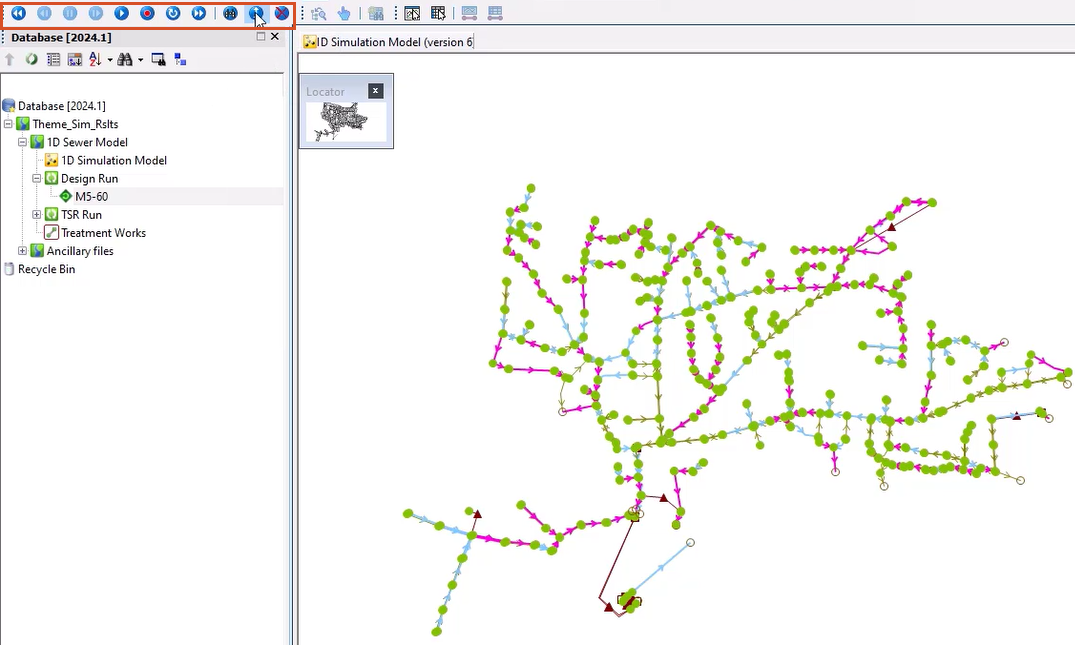
- Click Show maxima to display the maximum results for all locations at once.
To set up a second theme for flooding nodes:
- Right-click on the GeoPlan and select Properties & Themes.
- On the Layers and Themes tab, for the Nodes object layer, enable AutoLabel.
This helps identify particular flooding nodes.
- In the Theme column for the Node object layer, click Edit to access the themes for nodes.
- In the Layer Theme Editor, click the Add New button.
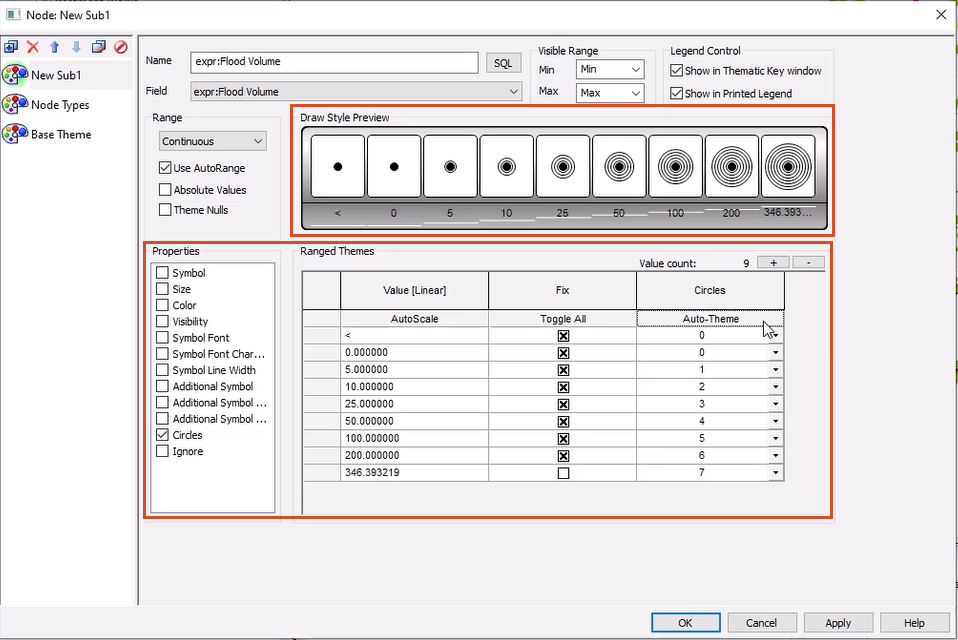
A theme is needed to sum both the stored and lost flood volumes, so they can be seen collectively.
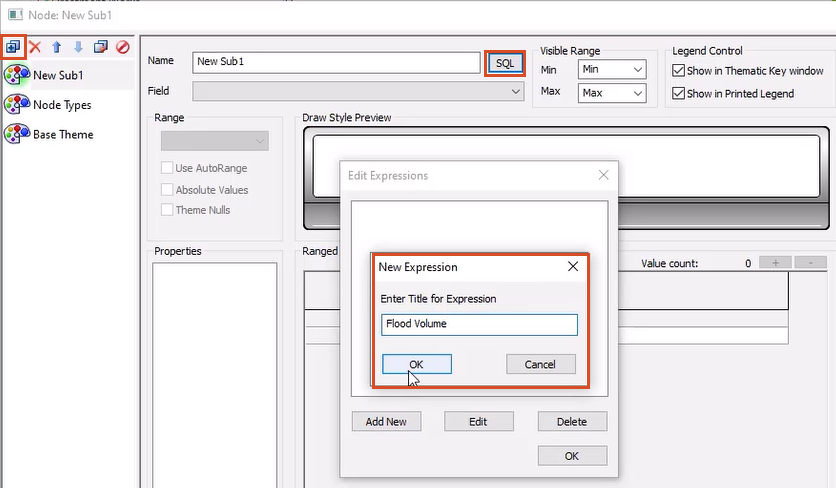
- Click SQL to create an expression.
- In the Edit Expressions popup, click Add New.
- In the New Expression dialog box, enter the name "Flood Volume", and then click OK.
To build the query:
- Set the Object Type to Node.
- Set the Field Type to sim.
- Expand the Field drop-down and select floodvolume.
- In the query, type a SPACE, a plus sign (+), and then another SPACE.
- Finally, from the Field drop-down, select flvol (volume lost).
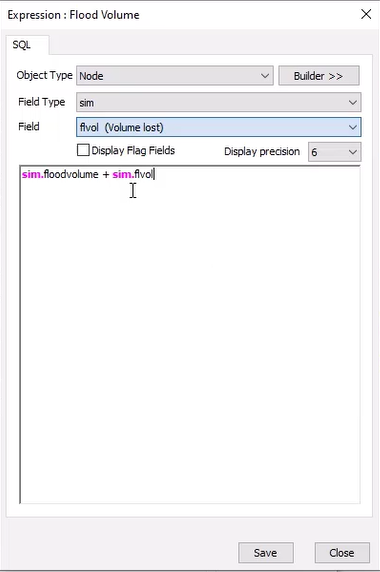
The query should look like this:
sim.floodvolume + sim.flvol
- Click Save.
- Click Close.
The new query appears in the Edit Expressions popup.
- Click OK.
The query is applied. To change the display of results:
- In the Layer Theme Editor, in the Properties list, deselect Color.
- Select Circles.
- In the Ranged Themes section, click the Value count plus symbol (+) until there are 9 rows.
- In the Fix column, click Toggle All.
- Deselect the box in the last row.
- In the Value [Linear] column, leave the first and last values as they are, and set rows 2 to 8 to 0, 5, 10, 25, 50, 100, and 200, respectively.
- In the Circles column, set the last row to 7.
- Click the Auto-Theme button.
In the Draw Style Preview section, a preview is displayed of the circles with the values at which they are applied.
- Click Apply.
- Click OK.
To save these themes for future use:
- Click Save.
- In the Network editing properties - save options popup, click OK.
- Enter a descriptive name, such as "1D Results" and select a location in the database.
- Click Save.
- Click OK.
These themes are now available to re-use with any simulation.
- Click OK to close the GeoPlan Properties and Themes dialog box.
Back in the GeoPlan, the flooding manholes now have concentric circles around them, indicating the volume of flooding that occurs.
- Use the Replay Control toolbar to play through the simulation to see the movement of flooding through the 1D network.
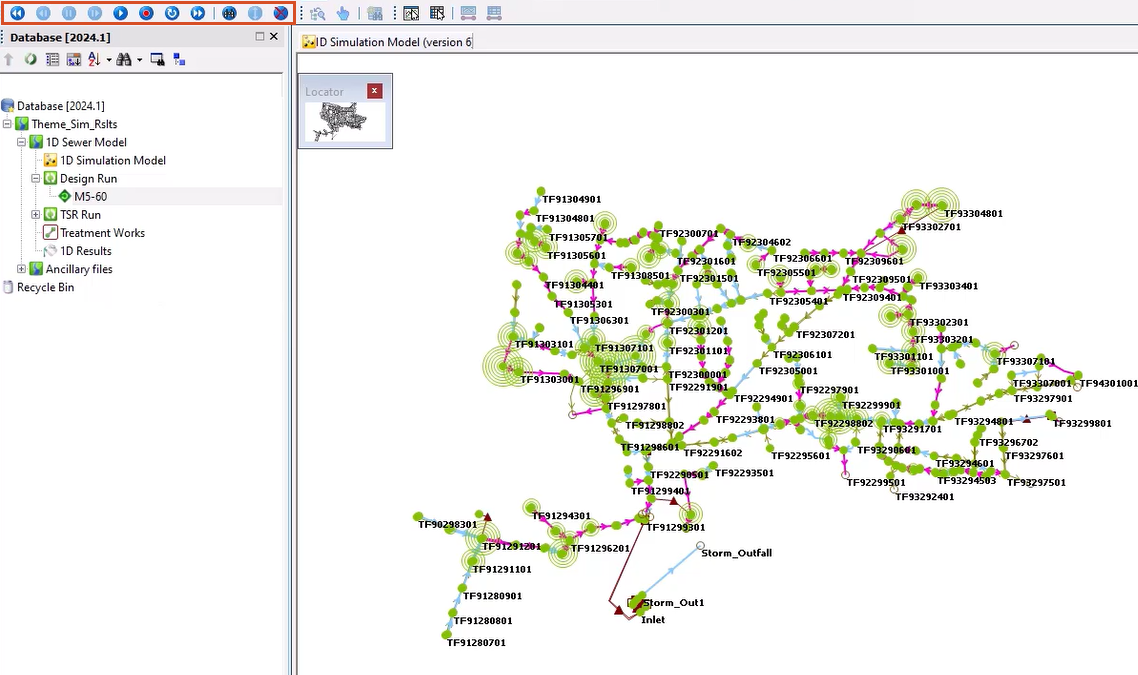
- Click Show maxima to display the maximum results for all locations at once.


