Modelling chlorination
Model the concentrations of chlorination within a hydraulic network.
Tutorial resources
These downloadable resources will be used to complete this tutorial:
Step-by-step Guide
InfoWorks WS Pro can model water quality in a network, tracking dissolved substances as they travel through it.
Water quality runs—especially those dealing with chlorination—tend to happen over an extended time to create a more stable simulation.
This example sets a baseline chlorination for all nodes in the network to represent the residue chlorine within the network. Then, it simulates regular doses of chlorine to the reservoir to maintain a concentration level throughout the network.
To set the baseline chlorination:
- From the Model Group window, Session 02, drag-and-drop BridgeNet into the workspace to open the GeoPlan.
- In the Scenarios toolbar, select Create scenario.
- Name the new scenario “Water Quality”.
- Enable Create matching scenario in the Control.
- Click OK.

- In the Scenarios toolbar, in the Select scenario drop-down, ensure that Water Quality is selected.
- Zoom into the reservoir on the left side of GeoPlan.
- Double-click node 544421 to view its properties.

- In the Properties panel, expand Water Quality.
- In the Water Quality Concentration cell, click More (…).

- In the profile graph window, in the Date Time column, expand the drop-down and select May 2, 2022.

- Leave the time of day set to 00:00:00.
- In the Conc. (mg/l) column, enter “1”.
- In the second row, set the date to May 2, 2022.
- Set the time to 08:00:00.
- Set the concentration to “100”.
- In the third row, set the date to May 2, 2022.
- Set the time to 14:00:00.
- Set the concentration to “1”.
- Click OK.
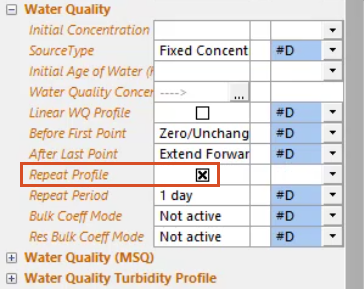
- In the Properties panel, Water Quality section, enable Repeat Profile.
To set the same dates, times, and concentrations for the other reservoir node:
- Repeat Step 10 to re-open the profile graph window for the first node.
- In the table, select all the values.

- Copy the values.
- Click OK.
- Repeat Steps 8-10 to open the profile graph window for the second node, 530491.
- Click in the top-left cell of the table.
- Paste the values.
- Click OK.

- Commit the changes to the database.
To create a new solute data object to test in the system, by assigning the properties of a substance to it:
- In the Model Group window, right-click Session 02 and select New > Solute Data Group.
- In the New Name – Solute Data Group dialog box, click OK.
- Right-click Solute Data Group and select New > Solute Data.

- In the New Name – Solute Data dialog box, enter the name “Chlorine”.
- Click OK.
- In the Model Group window, under Solute Data Group, double-click Chlorine.
- In the Solute Data – Chlorine window, Basic Water Quality tab, select Conservative Substance.
- Set the Initial Concentration or Unset Nodes (mg/l) to “5”.
- Set the Concentration Limit (mg/l) to “500”.
- Click Save.

- Close the window.
To simulate regular doses of chlorine to the reservoir:
- Create a new Run using the BridgeNet and BridgeCon network and control.
- In the Create New Scenario dialog box, enter the name “Water Quality-Chlorine”.
- Enable Experimental.
- In the Scenarios tab, disable the Base scenario.
- Enable the Water Quality scenario.
- Under Run Parameters, set the End field to May 9, 2022, to run the model for an extended time.

Notice the Start field is already set to May 2, 2022, a week before the end of the run. It is not necessary to set exact times for either of these fields.
- In the Run Type group box, expand the drop-down and pick Water Quality.
- From the Model Group window, drag the Chlorine solute data into the Water Quality Options dialog box and drop it in the Solute Data group box.

- Click OK.
Note: To easily reopen the Water Quality Options dialog box, click Options in the Run Type group box.
- Click Save.
- Click Run.

In the Model Group window, under Run Group, the simulation results now appear under Water Quality Chlorine.
- Drag-and-drop Water Quality into the GeoPlan.
- In the Tools toolbar, click Graph.
- In the GeoPlan, double-click a node.

- In the Select what to graph for dialog box, select Concentration 01 (mg/l).
- Click OK.
It is possible to include more than one substance at a time in a simulation, to compare how the concentrations of each dissipate over time. In this case, Concentration 01 represents the chlorine data object. Adding multiple solute data objects adds them to this list.
A graph opens, showing chlorine concentration at the selected node over time. In this example, because the selected node is immediately downstream from the reservoir, the initial concentration is low (around 5 mg/l), and then increases suddenly as chlorine arrives.

For comparison, graph concentrations at other nodes in the network.