Step-by-step:
To help you visualize steady state simulation results, you can create a color-coded thematic map based on attribute values.
- To begin, double-click the desired project .aprx file to open ArcGIS Pro.
- On the ribbon, InfoWater Pro tab, Project panel, click Initialize.
- On the InfoWater Pro ribbon, in the View panel, click Map Display.

In the Map Display dialog box, you can configure the map theme to display the needed information:
- Select Junction as the Element Type.
- Select Active Output as the Data Source.
- Expand the Data Field drop-down and select Pressure; as soon as you do, the color theme table appears in the panel.
- Set Classes to 4.
- Click Set Breaks.
- In the table, change the settings in the four rows:
- Row 1: Set the Color to Red, the Size to 7, and the Break to 20
- Row 2: Set the Color to Blue, Size to 5, and Break to 60
- Row 3: Set the Color to Green, the Size to 5, and the Break to 120
- Row 4: Set the Color to Yellow, the Size to 7, and the Break to 31
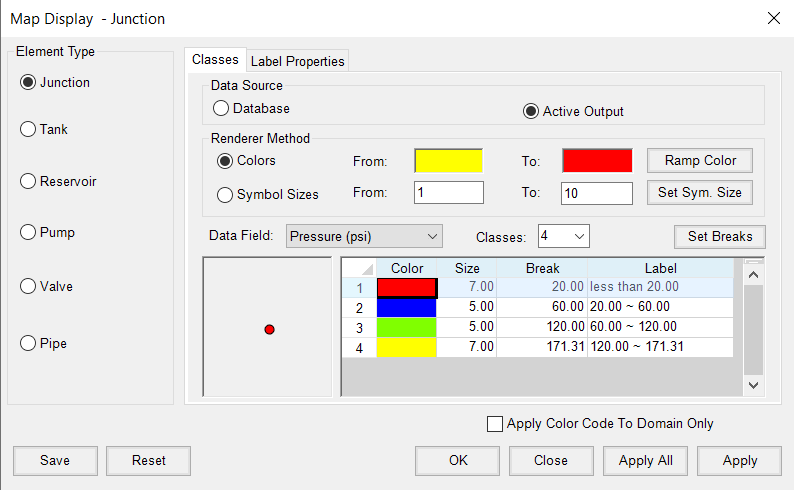
- Click Apply.
To color-code the pipes also:
- Select Pipe as the Element Type,
- Make sure that Active Output is selected as the Data Source.
- Expand the Data Field drop-down and select Velocity.
- Set Classes to 3 and then click Set Breaks.
- In the table, change the settings in the three rows:
- Row 1: Set Color to Yellow, Size to 2, and the Break to 0.5
- Row 2: Set the Color to Green, the Size to 1, and Break to 1.5
- Row 3: Set the Color to Red, Size to 2, and the Break to 10

- Click Apply.
- Close the Map Display dialog box.
- Pan the map view to see the pressure and velocity displayed by the color-coded ranges that you just set.
- Zoom into any areas that may require further review.

Note: This example is based on a steady state analysis, therefore, this is just a snapshot in time for this system. It is also possible to create a thematic map based on a time varying output.
- When you are finished, on the InfoWater Pro ribbon, View panel, click Reset Map Display to reset the map to the default display (as set in the Preferences).


