00:03
A contour is a collection of poly lines that
00:06
illustrates the spatial variability for an info water pro model
00:11
contours can be generated for any numeric junction
00:14
based model input field or simulation result.
00:19
You can create pressure contours for a steady state
00:22
simulation result as a method for visualizing the results
00:27
Double click the desired project dot APR X file to open Argi
00:33
Once the project starts, click the info water pro tab to open info water pro ribbon
00:40
in the project panel, click initialize
00:45
first, you must define the domain
00:48
on the info water pro ribbon
00:50
in the domain panel, click domain manager
00:54
in the domain manager choose network as the element
00:57
source and then in the adjacent drop down,
00:60
select all junctions,
01:04
all junctions in the map are now displayed in red.
01:08
Now choose map selection as the element source and click remove
01:16
select the junction between the water treatment plant and the two nearby pumps.
01:22
If you cannot locate the junction,
01:24
you can use the model explorer to search for J 1404.
01:30
Once you have it selected
01:32
right, click anywhere in the map and select enter
01:36
this junction is removed from the domain.
01:39
Because in this particular model,
01:41
it is so close to the reservoir that it has
01:43
an artificially reduced pressure which would affect the contour lines.
01:48
Removing it from the domain ensures the contour lines will be more accurate.
01:54
Close the domain manager.
01:58
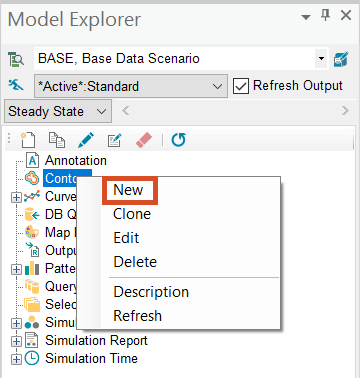
Now, you can create the contours
02:01
in the model explorer on the operation tab,
02:04
click contour and select new
02:07
enter pressure as the contour id
02:17
you define the data source
02:20
in the element source group, choose use domain
02:24
under data source, select output active standard.
02:30
Then for the data category, select pressure
02:34
switch to the level tab.
02:36
Here you will manually set the values for the color ramp.
02:39
So deselect the option compute level automatically while contouring.
02:46
Then in the value ramp group set the from value to 40
02:50
the two value to 160
02:53
and set the increments to 10
02:59
the colors in the color ramp update.
03:02
Switch to the labeling tab.
03:05
Ensure that label contour line is selected and select show unit.
03:11
Keep the contour lined with set to two.
03:14
And in the decimal dropdown, select zero
03:18
in the placement option group enable the place on option.
03:23
Ensure that the label field dropdown is set to label
03:28
click. OK, to close the contour dialog box and generate the contours
03:34
zoom out to view the results
03:37
contours are generated as an external shape file and can be
03:41
displayed at any time before or after a simulation run.
03:46
Also be aware that they are saved as a permanent layer of an info water pro project
03:52
in the contents pane note that you can toggle
03:54
the visibility of the pressure contours on or off.