& Construction

Integrated BIM tools, including Revit, AutoCAD, and Civil 3D
& Manufacturing

Professional CAD/CAM tools built on Inventor and AutoCAD

Integrated BIM tools, including Revit, AutoCAD, and Civil 3D

Professional CAD/CAM tools built on Inventor and AutoCAD
Assess the need for a calibration run.
Type:
Tutorial
Length:
4 min.
Tutorial resources
These downloadable resources will be used to complete this tutorial:
Transcript
00:03
A prerequisite for network model calibration is that overall flow balances—
00:08
—demands, leakage, and transfers—
00:12
—are in reasonable agreement for both the model and the real-world network for the specified time period.
00:19
To determine the performance of the current network,
00:21
and to validate that a calibration exercise needs to take place,
00:26
you need to compare the simulated pressure and flows with observed values.
00:31
The simulated values are from the results of a normal hydraulic simulation,
00:36
and the observed values are provided by a live data configuration.
00:41
You can then compare the live and predicted results using either graphs or grid reports.
00:48
Observed vs Predicted Reports allow you to compare summary flow, pressure,
00:54
or reservoir depth for all network objects of an appropriate type in the model that are linked to live data.
01:01
Simulation Graphs allow you to produce graphs of the comparison between observed
01:06
and predicted data for all the selected objects of appropriate type that are linked to live data.
01:12
For this exercise, you will produce an observed versus predicted report.
01:17
Begin by running a normal hydraulic simulation.
01:21
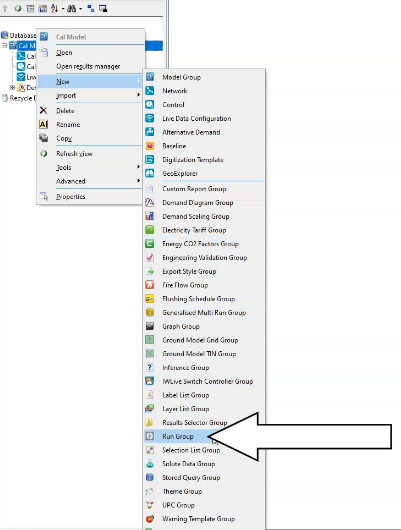
Create a new Run Group object.
01:23
In the Model Group, right-click the Calibration Model model group and select New > Run Group.
01:32
Then, right-click the new run group and select New > Run from the flyout.
01:39
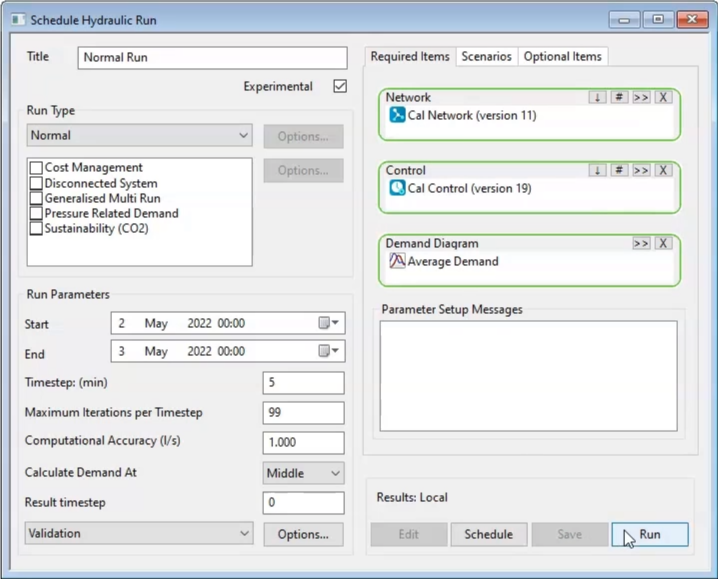
The Schedule Hydraulic Run dialog opens.
01:43
In the Title field, type a name for the run.
01:46
In this example, “Normal Run” is entered.
01:50
Check the box next to Experimental.
01:53
Then, from the Model Group, drag and drop the Calibration network into the Network panel in the dialog.
02:01
The Control and Demand Diagram panels populate as well.
02:05
Click Save, and then Run.
02:08
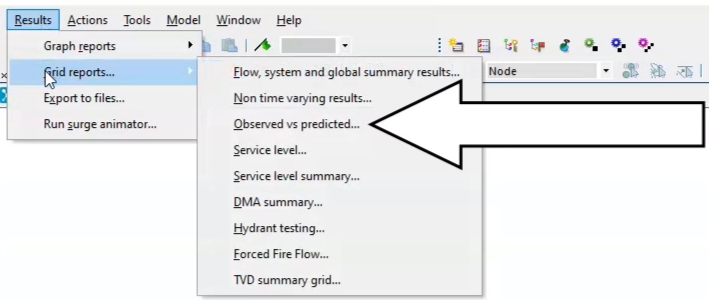
Next, to produce the observed versus simulated grid,
02:12
double click on the Cal Control simulation results, then expand the Results menu and select Grid reports,
02:21
and then from the flyout, select Observed vs predicted.
02:26
The Grid Report (Observed vs Predicted) dialog box appears.
02:31
From the Model Group, drag and drop the Normal Run simulation into the Sim panel,
02:38
and then drag and drop the live data configuration into the Live Data Configuration panel.
02:45
Under Options, enable Pressure, and then click Produce Grid.
02:51
A table appears, providing some values and a verdict for each point in the network that has a live data pressure feed associated with it.
03:00
In this example, you can see that three points have a fair verdict;
03:05
therefore, running the automatic calibration module may improve the performance.
Video transcript
00:03
A prerequisite for network model calibration is that overall flow balances—
00:08
—demands, leakage, and transfers—
00:12
—are in reasonable agreement for both the model and the real-world network for the specified time period.
00:19
To determine the performance of the current network,
00:21
and to validate that a calibration exercise needs to take place,
00:26
you need to compare the simulated pressure and flows with observed values.
00:31
The simulated values are from the results of a normal hydraulic simulation,
00:36
and the observed values are provided by a live data configuration.
00:41
You can then compare the live and predicted results using either graphs or grid reports.
00:48
Observed vs Predicted Reports allow you to compare summary flow, pressure,
00:54
or reservoir depth for all network objects of an appropriate type in the model that are linked to live data.
01:01
Simulation Graphs allow you to produce graphs of the comparison between observed
01:06
and predicted data for all the selected objects of appropriate type that are linked to live data.
01:12
For this exercise, you will produce an observed versus predicted report.
01:17
Begin by running a normal hydraulic simulation.
01:21
Create a new Run Group object.
01:23
In the Model Group, right-click the Calibration Model model group and select New > Run Group.
01:32
Then, right-click the new run group and select New > Run from the flyout.
01:39
The Schedule Hydraulic Run dialog opens.
01:43
In the Title field, type a name for the run.
01:46
In this example, “Normal Run” is entered.
01:50
Check the box next to Experimental.
01:53
Then, from the Model Group, drag and drop the Calibration network into the Network panel in the dialog.
02:01
The Control and Demand Diagram panels populate as well.
02:05
Click Save, and then Run.
02:08
Next, to produce the observed versus simulated grid,
02:12
double click on the Cal Control simulation results, then expand the Results menu and select Grid reports,
02:21
and then from the flyout, select Observed vs predicted.
02:26
The Grid Report (Observed vs Predicted) dialog box appears.
02:31
From the Model Group, drag and drop the Normal Run simulation into the Sim panel,
02:38
and then drag and drop the live data configuration into the Live Data Configuration panel.
02:45
Under Options, enable Pressure, and then click Produce Grid.
02:51
A table appears, providing some values and a verdict for each point in the network that has a live data pressure feed associated with it.
03:00
In this example, you can see that three points have a fair verdict;
03:05
therefore, running the automatic calibration module may improve the performance.
A prerequisite for network model calibration is that overall flow balances—demands, leakage, and transfers—are in reasonable agreement for both the model and the real-world network for the specified time period.
To determine the performance of the current network, and to validate that a calibration exercise needs to take place, compare the simulated pressure and flows with observed values:
Compare the live and predicted results using either graphs or grid reports:
To produce an observed versus predicted report:
Note: The Control and Demand Diagram panels populate as well.
To produce the observed versus simulated grid:
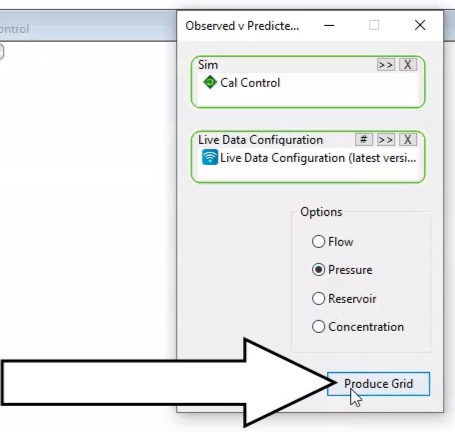
A table appears. Two points have a Fair verdict:
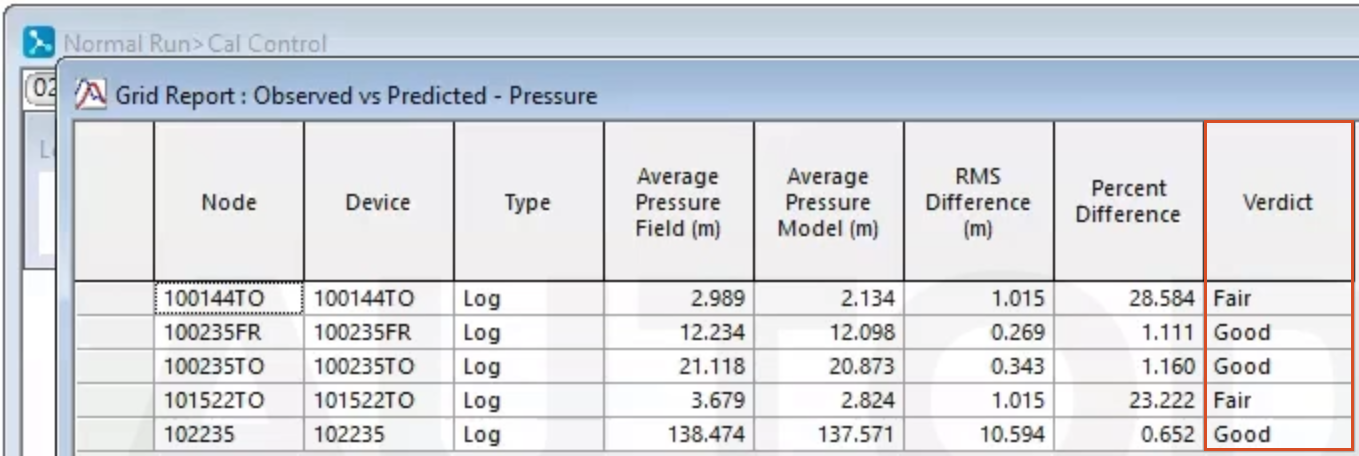
Therefore, running the automatic calibration module may improve the performance.
How to buy
Privacy | Do not sell or share my personal information | Cookie preferences | Report noncompliance | Terms of use | Legal | © 2025 Autodesk Inc. All rights reserved
Sign in for the best experience
Save your progress
Get access to courses
Receive personalized recommendations
May we collect and use your data?
Learn more about the Third Party Services we use and our Privacy Statement.May we collect and use your data to tailor your experience?
Explore the benefits of a customized experience by managing your privacy settings for this site or visit our Privacy Statement to learn more about your options.