00:03
A model with a poor observed vs simulated verdict may need an adjustment in the pipe friction factors throughout the network.
00:11
These can be automatically determined and adjusted using the automatic calibration routine.
00:18
Begin by creating a calibration simulation.
00:22
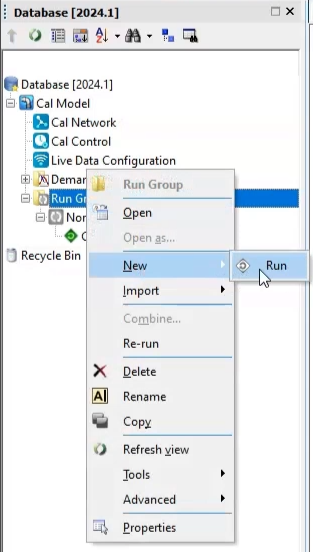
From the Model Group, right-click Run Group and select New > Run from the flyout.
00:28
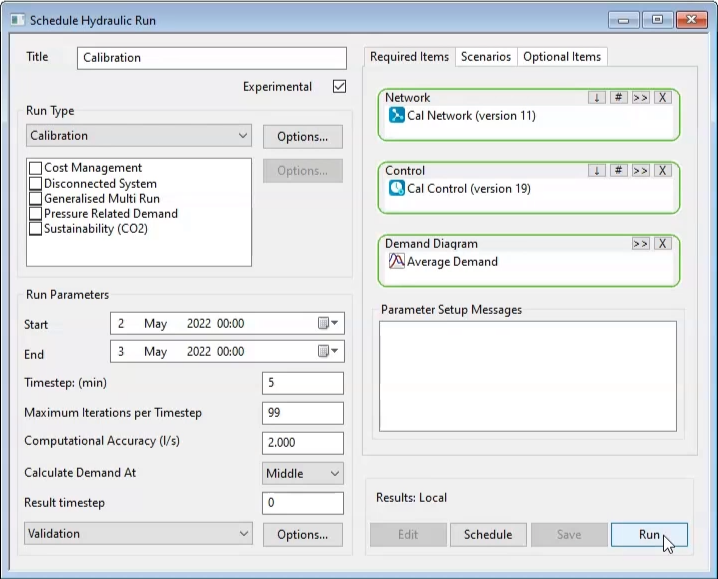
The Schedule Hydraulic Run dialog opens.
00:32
Type a name for the run in the Title field.
00:35
For this exercise, call this run “Calibration”, and then enable Experimental.
00:41
Then, from the Model Group, drag and drop the Calibration network into the Network panel in the Schedule Hydraulic Run dialog.
00:50
The Control and Demand Diagram group boxes populate as well.
00:55
In the Run Type group box, expand the drop-down and select Calibration.
01:01
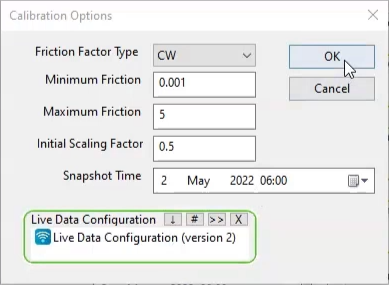
The Calibration Options dialog opens.
01:04
Here, set the Minimum Friction factor to 0.001, the Maximum Friction factor to 5, and the Initial Scaling Factor to 0.5.
01:16
Set the snapshot time to 2 May 2022 at 06:00.
01:24
Then, from the Model Group, drag and drop the Live Data Configuration into the Live Data Configuration panel.
01:32
Note that if you close this dialog, you can easily reopen it by clicking the options button in the Run Type group box.
01:42
In the Run Parameters group box, set the Computational Accuracy to 2 liters per second.
01:48
Click Save and then Run.
01:51
Once the run is complete, the pipe friction factors can be updated.
01:56
It is best practice to update the friction factors in a scenario first, before altering a base model.
02:03
In the Scenarios toolbar, click Create scenario, or expand the Scenarios menu and select Create scenario.
02:12
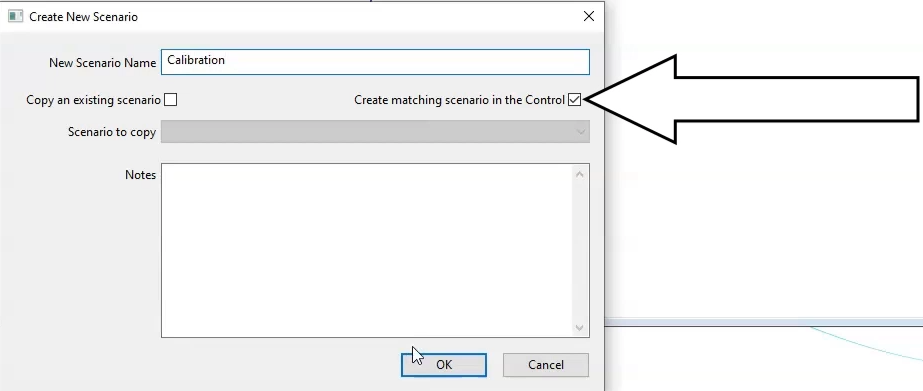
In the Create New Scenario dialog, in the New Scenario Name field, type “Calibration”.
02:19
Enable the option Create matching scenario in the Control.
02:26
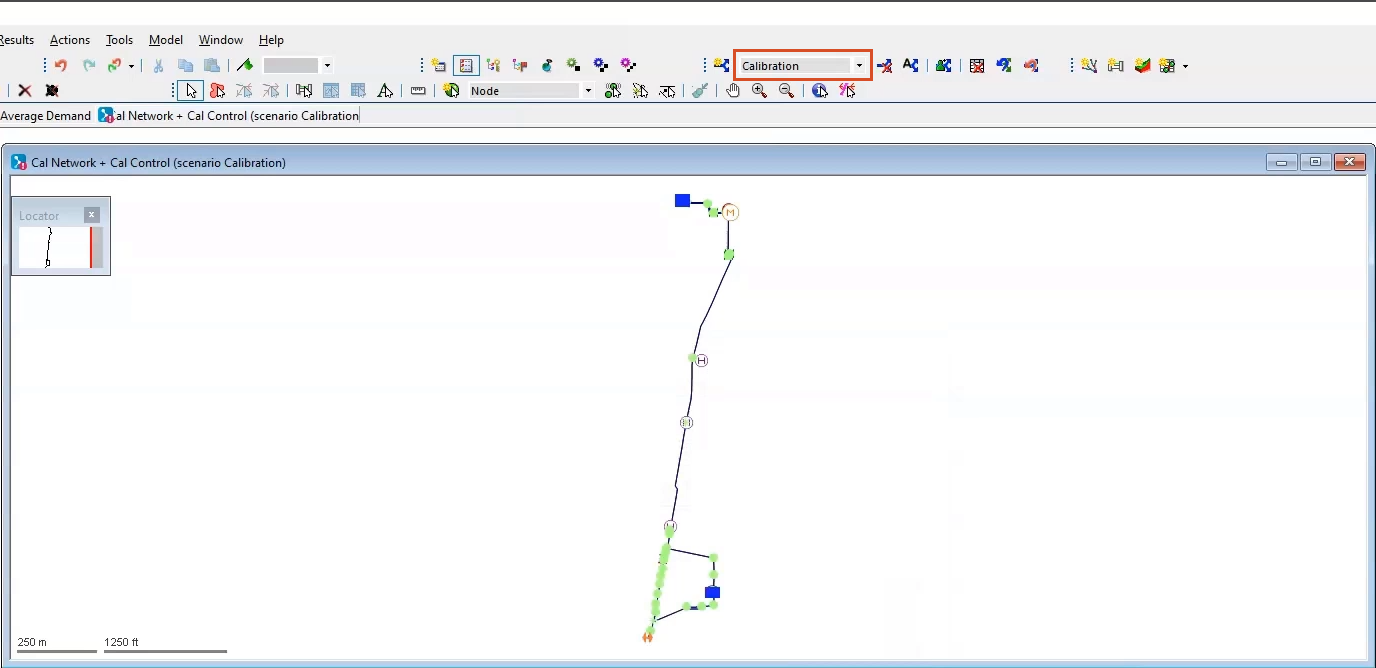
The Calibration scenario now appears in the drop-down in the toolbar.
02:31
Ensure that the Calibration Scenario is selected.
02:35
Next, expand the Network menu and select Update from calibration > From simulation.
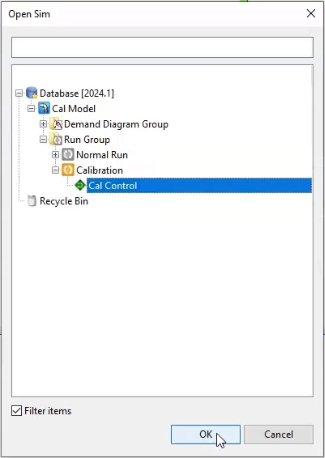
02:43
In the Open Sim dialog, select the calibration simulation, and then click OK.
02:50
The friction factors of the pipes in the calibration scenario have been adjusted.
02:55
Save all the changes to the database.
03:00
Right-click Run Group, then select New > Run.
03:05
The Schedule Hydraulic Run dialog opens.
03:08
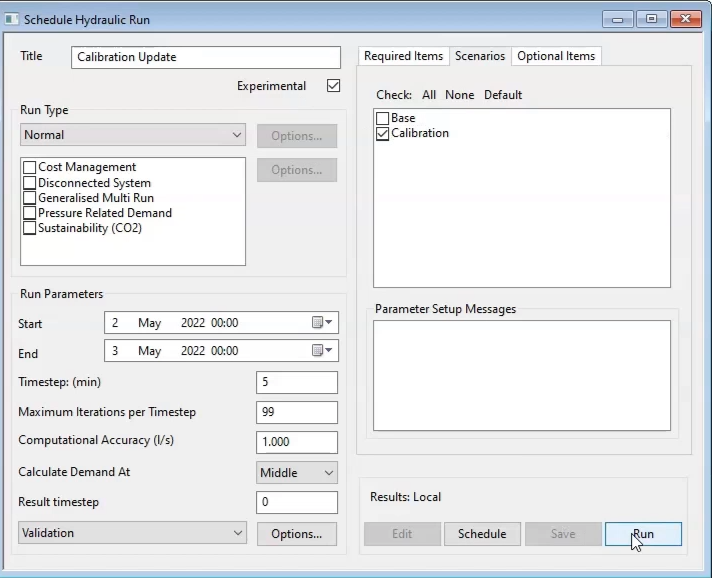
Type a name for the run in the Title field.
03:11
For this exercise, call it “Calibration Update”.
03:15
Check the box next to Experimental.
03:18
Then, from the Model Group window, drag and drop the Calibration network into the Network box in the dialog.
03:26
The Control and Demand Diagram boxes populate as well.
03:30
In the Scenarios tab, deselect the Base scenario and enable the Calibration scenario.
03:37
Click Save and then Run.
03:40
Now, you can produce the observed vs simulated grid for the updated simulation.
03:46
Expand the Results menu and select Grid reports > Observed vs predicted.
03:52
The Grid Report (Observed vs Predicted) dialog opens.
03:57
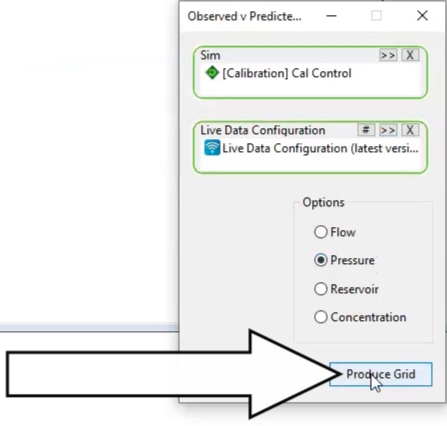
From the Model Group, drag and drop the Calibration Update simulation into the Sim box of the dialog.
04:04
Then, drag and drop the live data configuration into the Live Data Configuration box.
04:11
Under the Options, select Pressure, and then click Produce Grid.
04:17
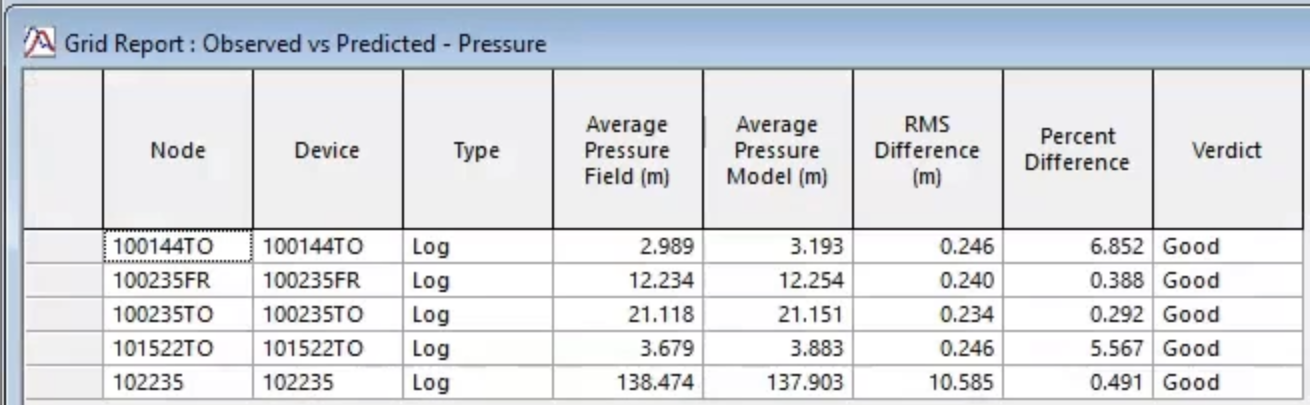
The Grid Report opens, displaying the observed versus predicted data.
04:22
Determine whether the verdict has improved following the calibration.
04:26
If it has, you can reintegrate the Calibration scenario into the base model.
04:32
With the Calibration Network and Calibration Control open in the workspace and set to the Calibration scenario,
04:40
in the toolbar, click Manage scenarios.
04:44
A notification appears, asking you what type of scenario you want to manage.
04:50
Click Network to open the Manage Network Scenarios dialog.
04:55
Notice that the Calibration scenario is highlighted at the bottom of the list.
04:60
To make this scenario the new baseline scenario, click Reintegrate.
05:05
Click Yes in the notification that appears asking if you want to reintegrate this scenario.
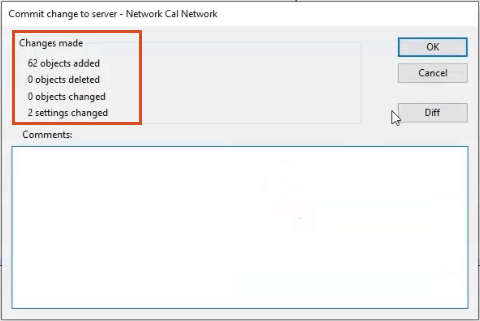
05:13
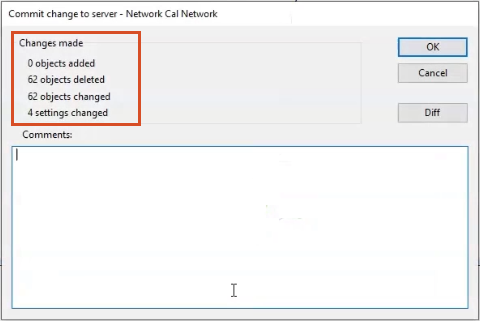
Commit the changes to the database.