Running and analyzing the results from an MSQ simulation
Run an MSQ simulation and analyze the MSQ results.
Tutorial resources
These downloadable resources will be used to complete this tutorial:
Step-by-step guide
When performing a multi solute water quality simulation, after the MSQ model has been set up using the Solute Data Object dialog box, and after the network has been dosed with the contaminants, you can configure and run the MSQ simulation.
- In the Database, right-click the MSQ Model.
- Select New > Run Group.
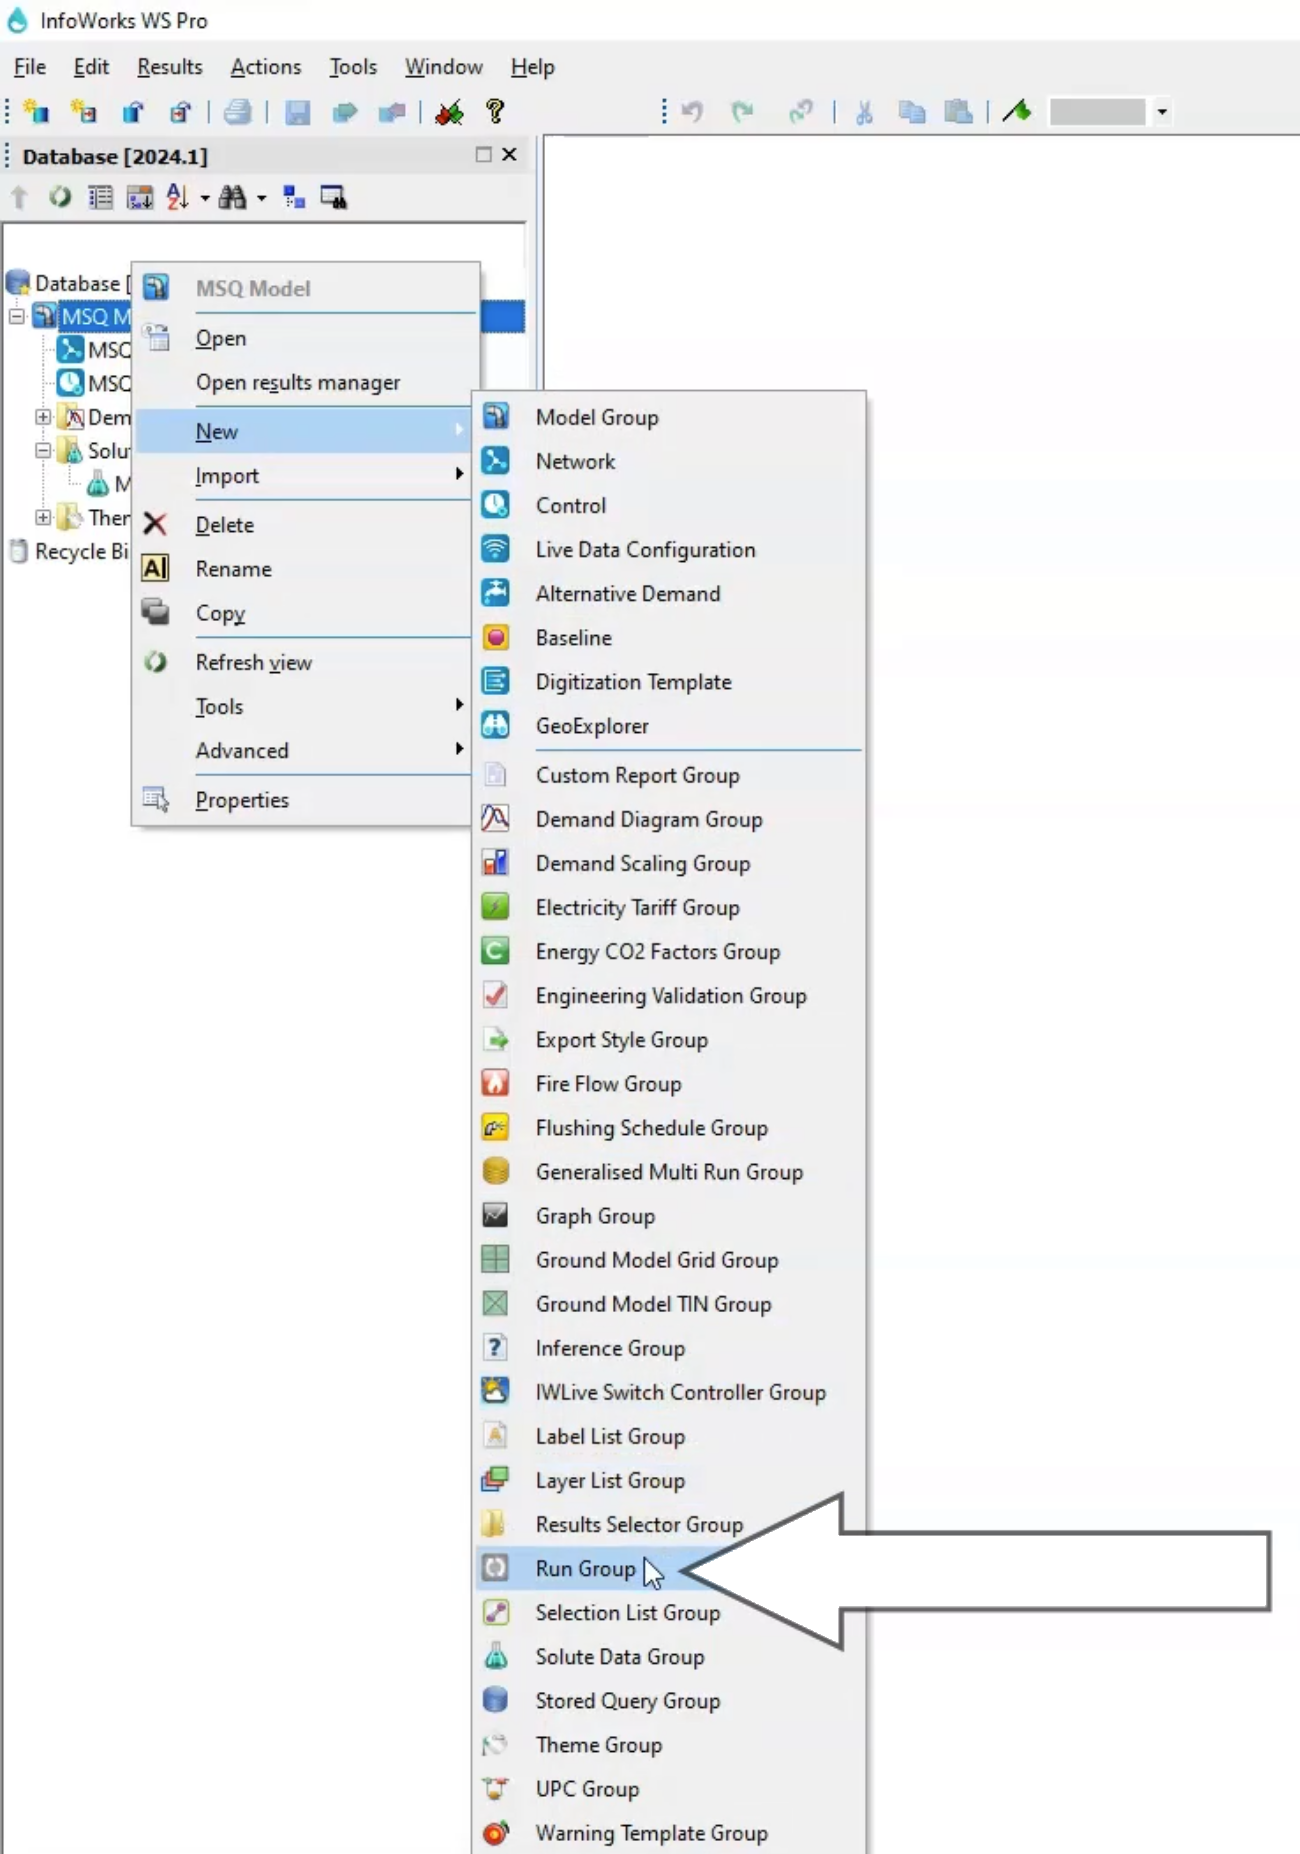
- In the popup, type the name “Run Group”.
- Click OK.
- Right-click the Run Group and select New > Run.
- In the Schedule Hydraulic Run dialog box, name the simulation “MSQ Example”.
- Enable Experimental.
- From the Model Group, drag MSQ Network into the Schedule Hydraulic Run dialog box and drop it into its respective box.
The Control and Demand Diagram boxes populate automatically.
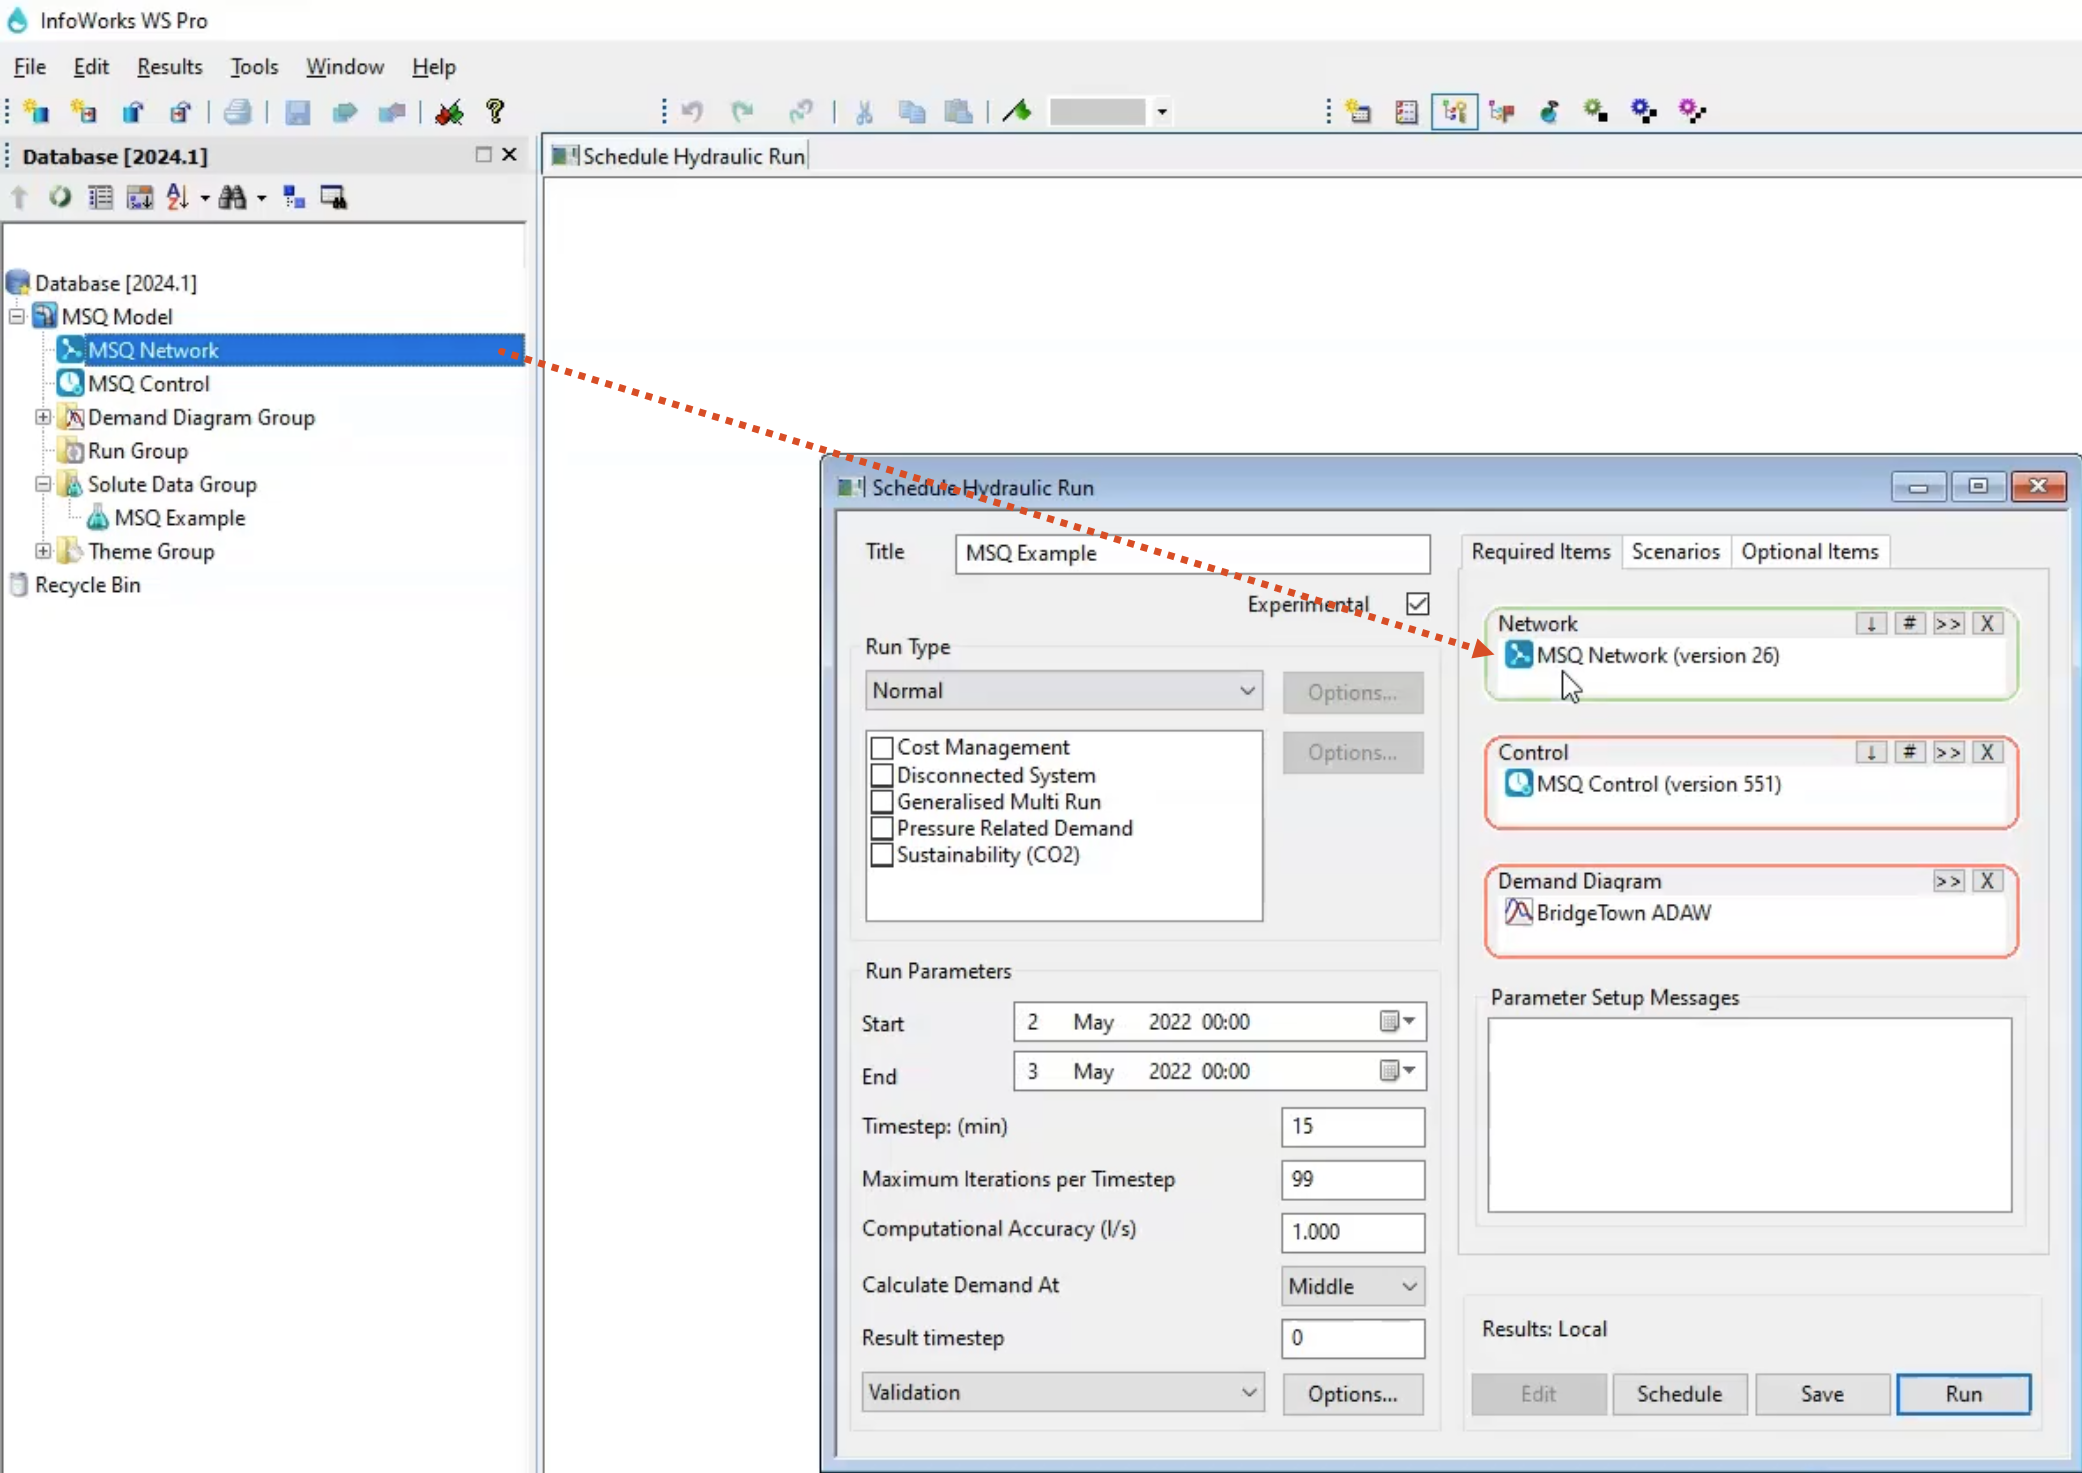
- Set the Start date and time to May 2, 2022 at 00:00.
- Set the End date and time to May 4, 2022 at 00:00.
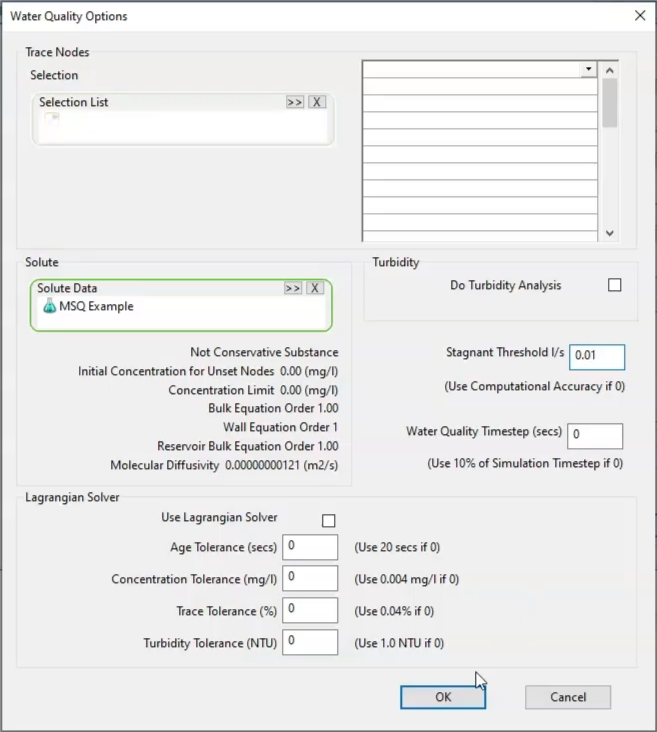
- In the Run Type group box, expand the drop-down and pick Water Quality to open the Water Quality Options dialog box.
- From the Database, drag the MSQ Example solute data into the Water Quality Options dialog box and drop it into the Solute Data box.
- Set the Stagnant Threshold to 0.01 l/s.
- Click OK.
Note that you can reopen the Water Quality Options dialog box from the Schedule Hydraulic Run dialog box, Run Type group box, by clicking the Options button.
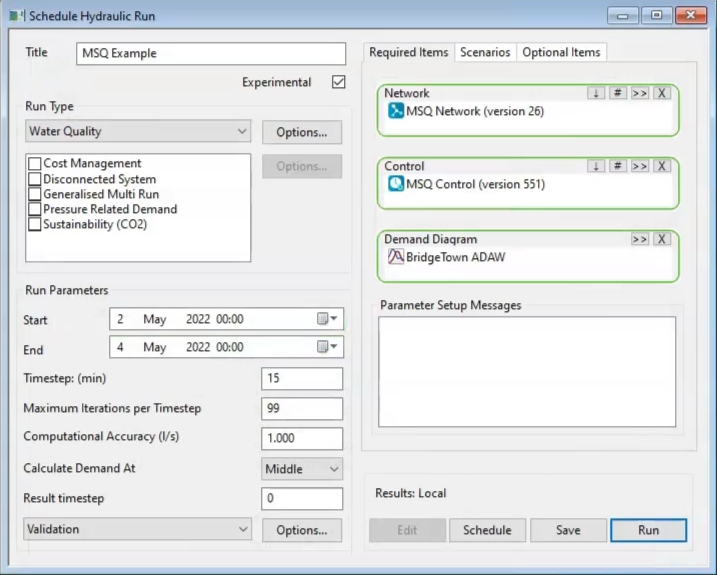
- Back in the Schedule Hydraulic Run dialog box, click Save.
- Click Run.
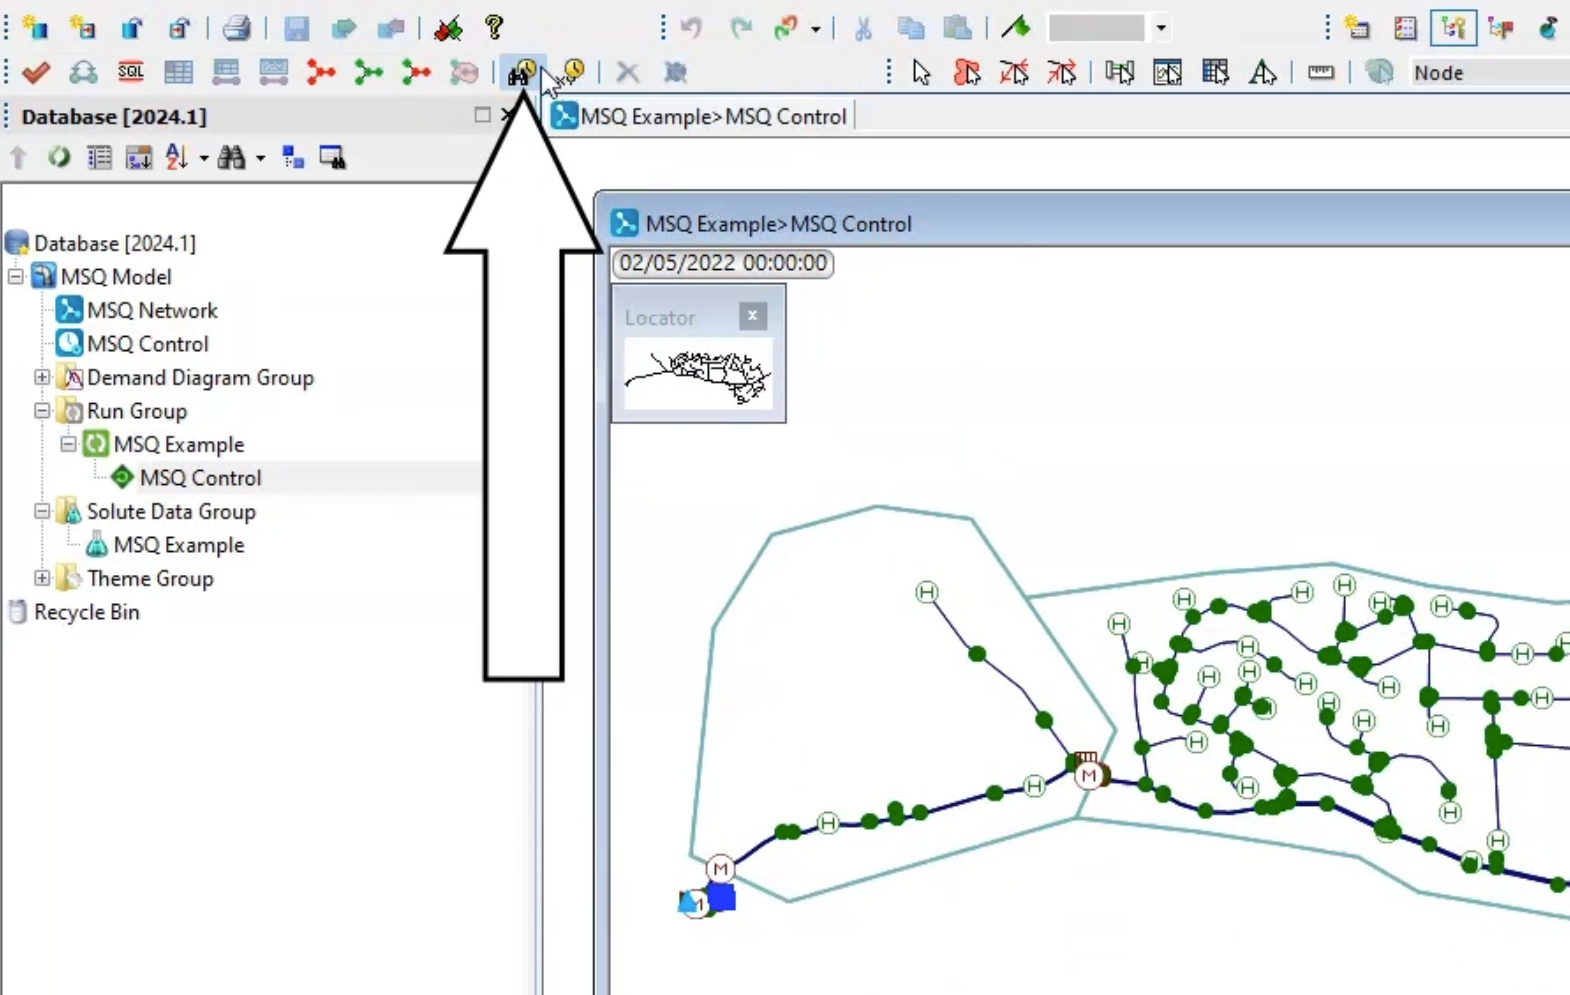
In the Model Group, the simulation results now appear under the MSQ Example run.
To graph the results:
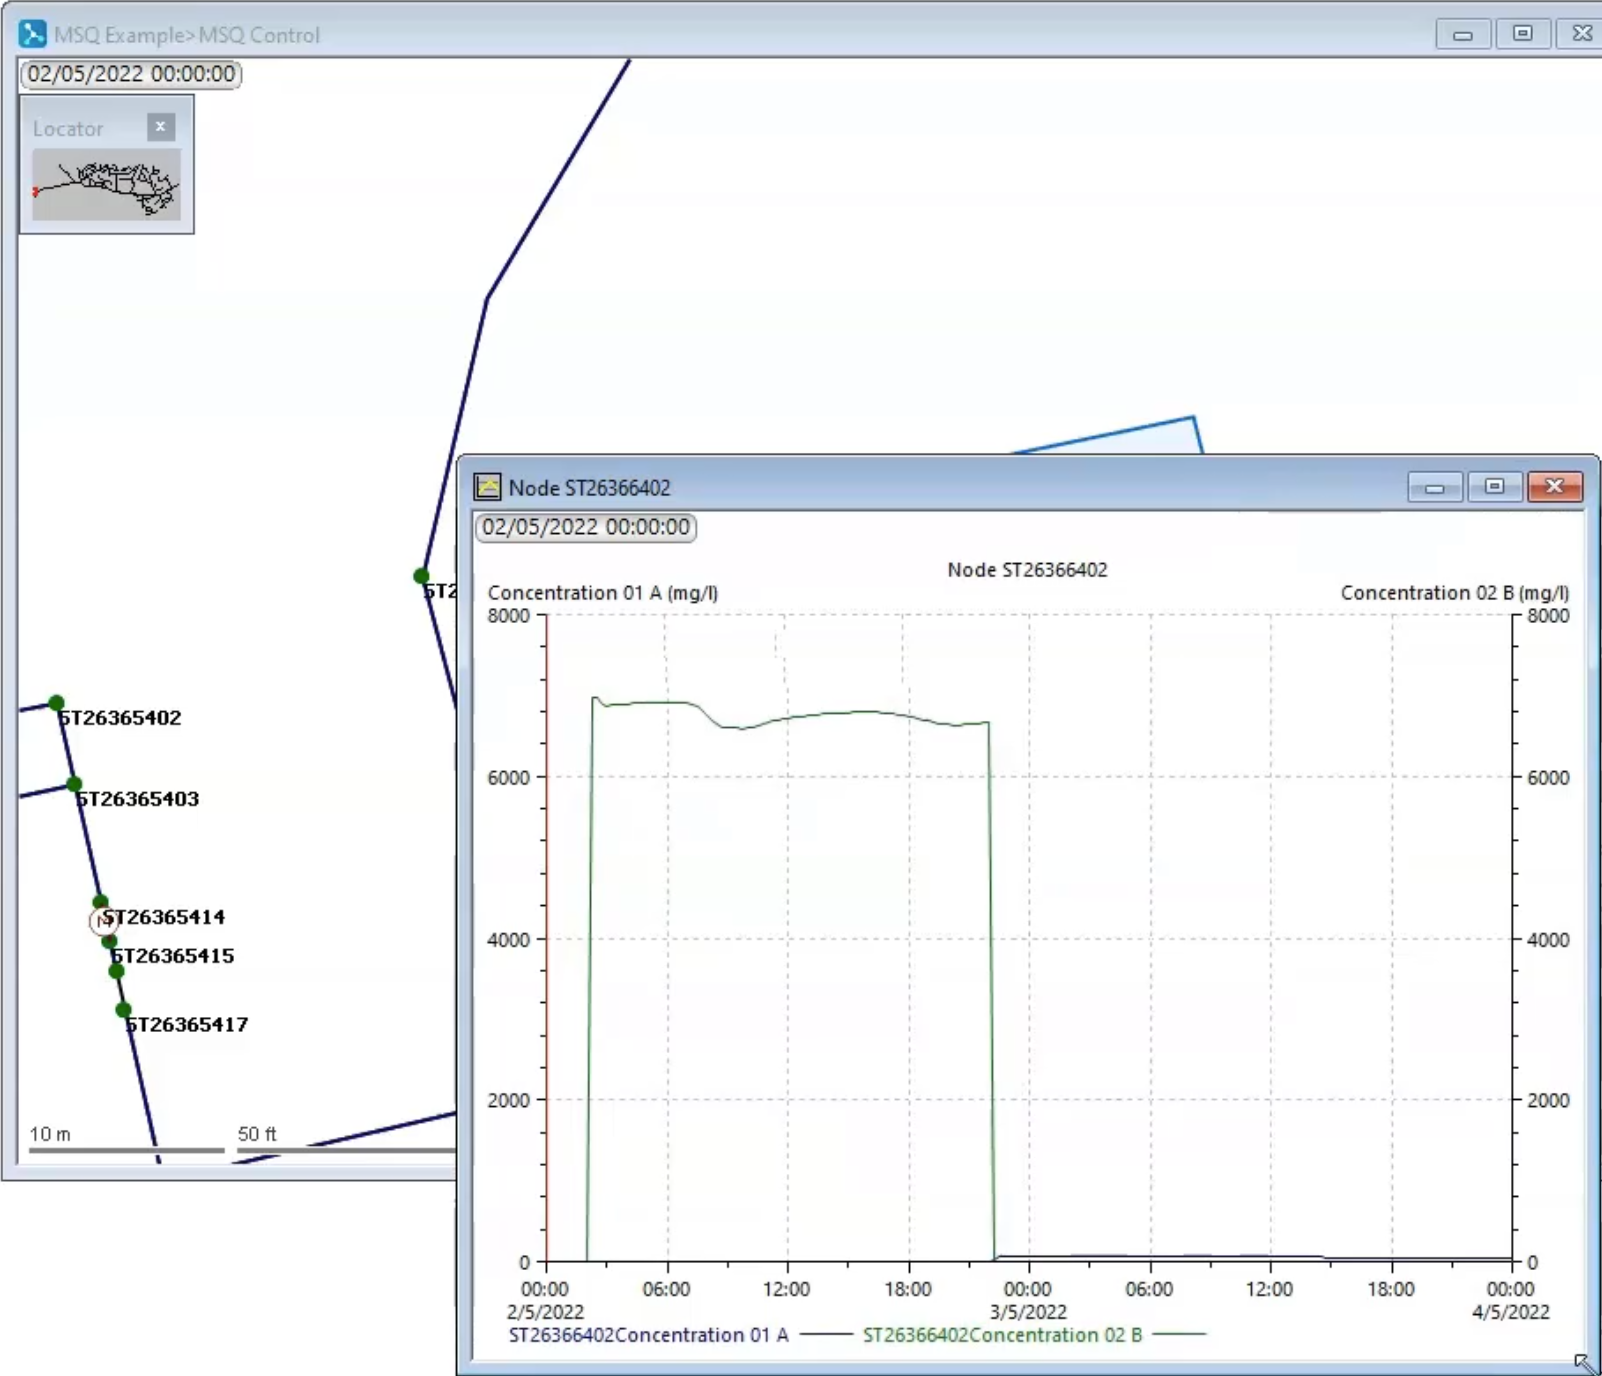
- Drag the MSQ Control results and drop them onto the GeoPlan.
- In the Operations toolbar, click the Find network objects tool.
- In the Wildcard text box, enter the Node ID ST26366402.
- Click Select and find.
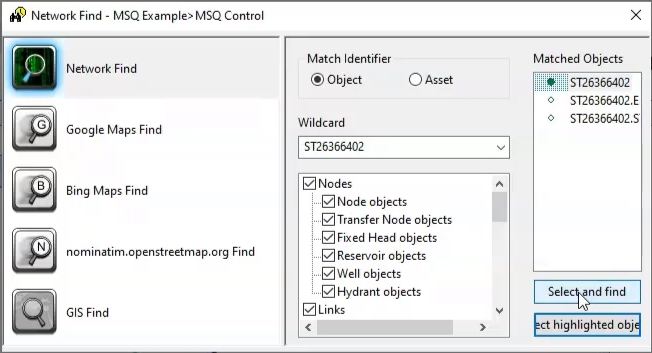
- Close the Network Find window.
- In the Operations toolbar, click the Graph selected objects tool.
- In the Graph Selection dialog box, in the Left group box, select Concentration 01 A.
- In the Right group box, select Concentration 02 B.
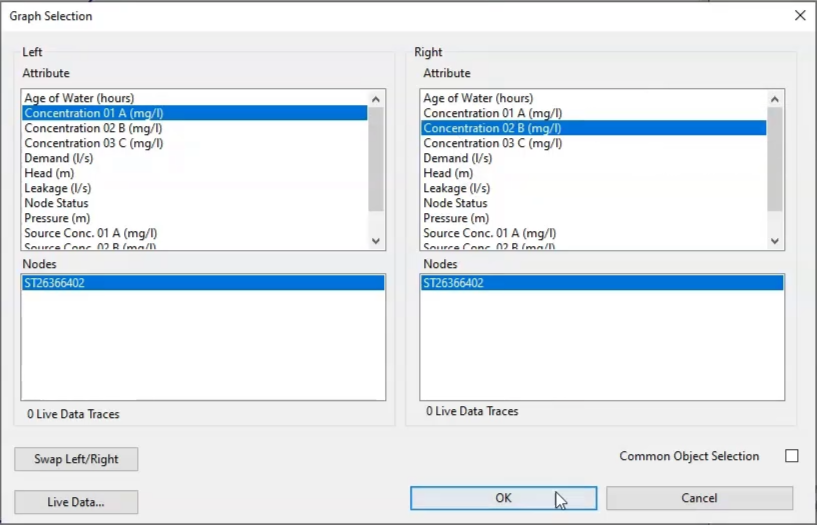
- Click OK.
On the graph, you can see the concentration of the two contaminants at the point below the reservoir across the simulation.
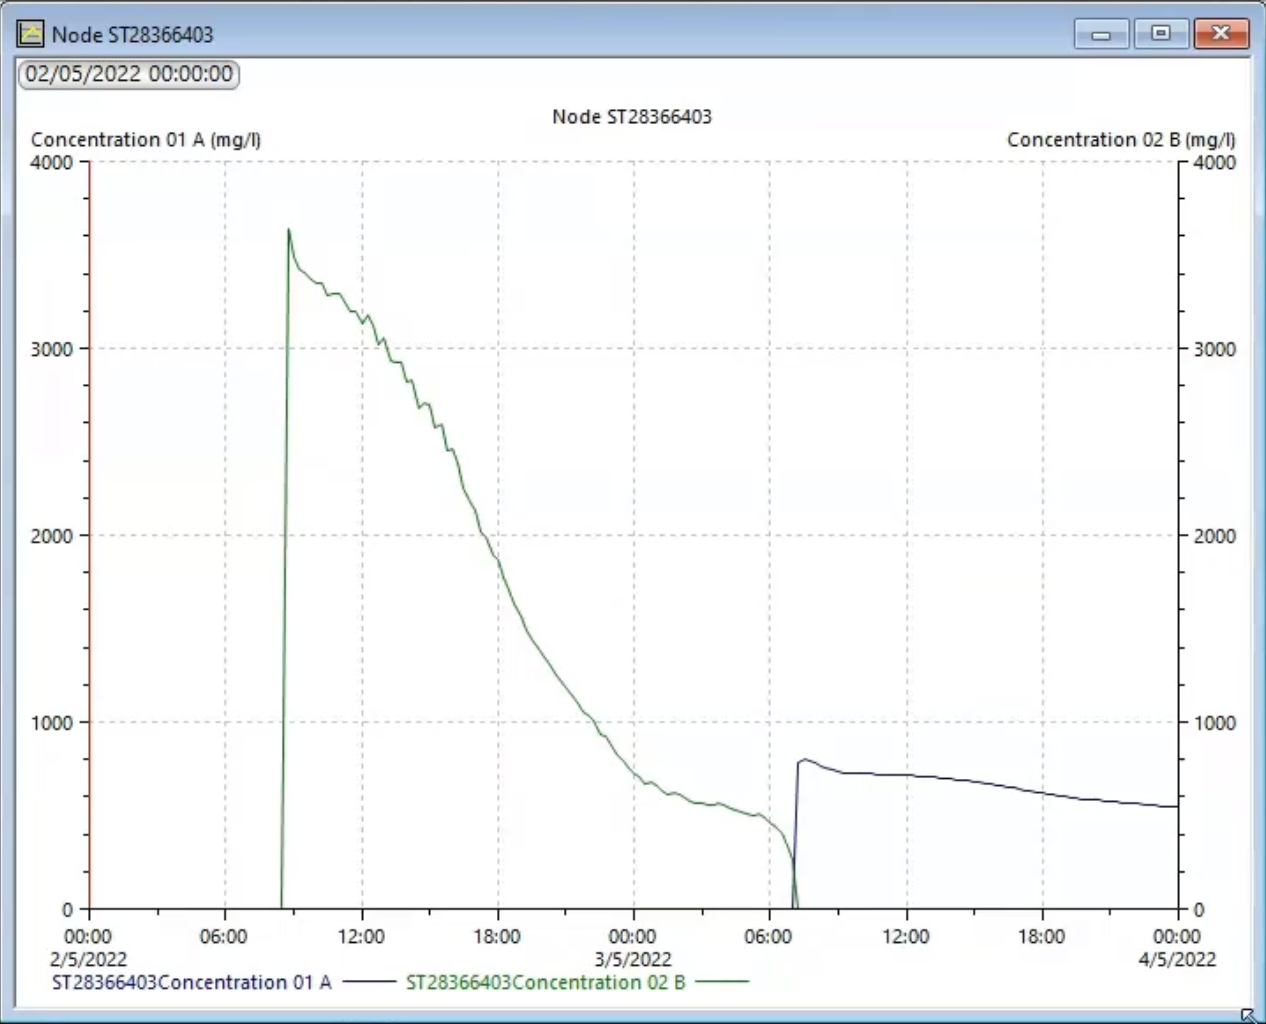
- Repeat steps 21-28 to create a graph for Node ST28366403.
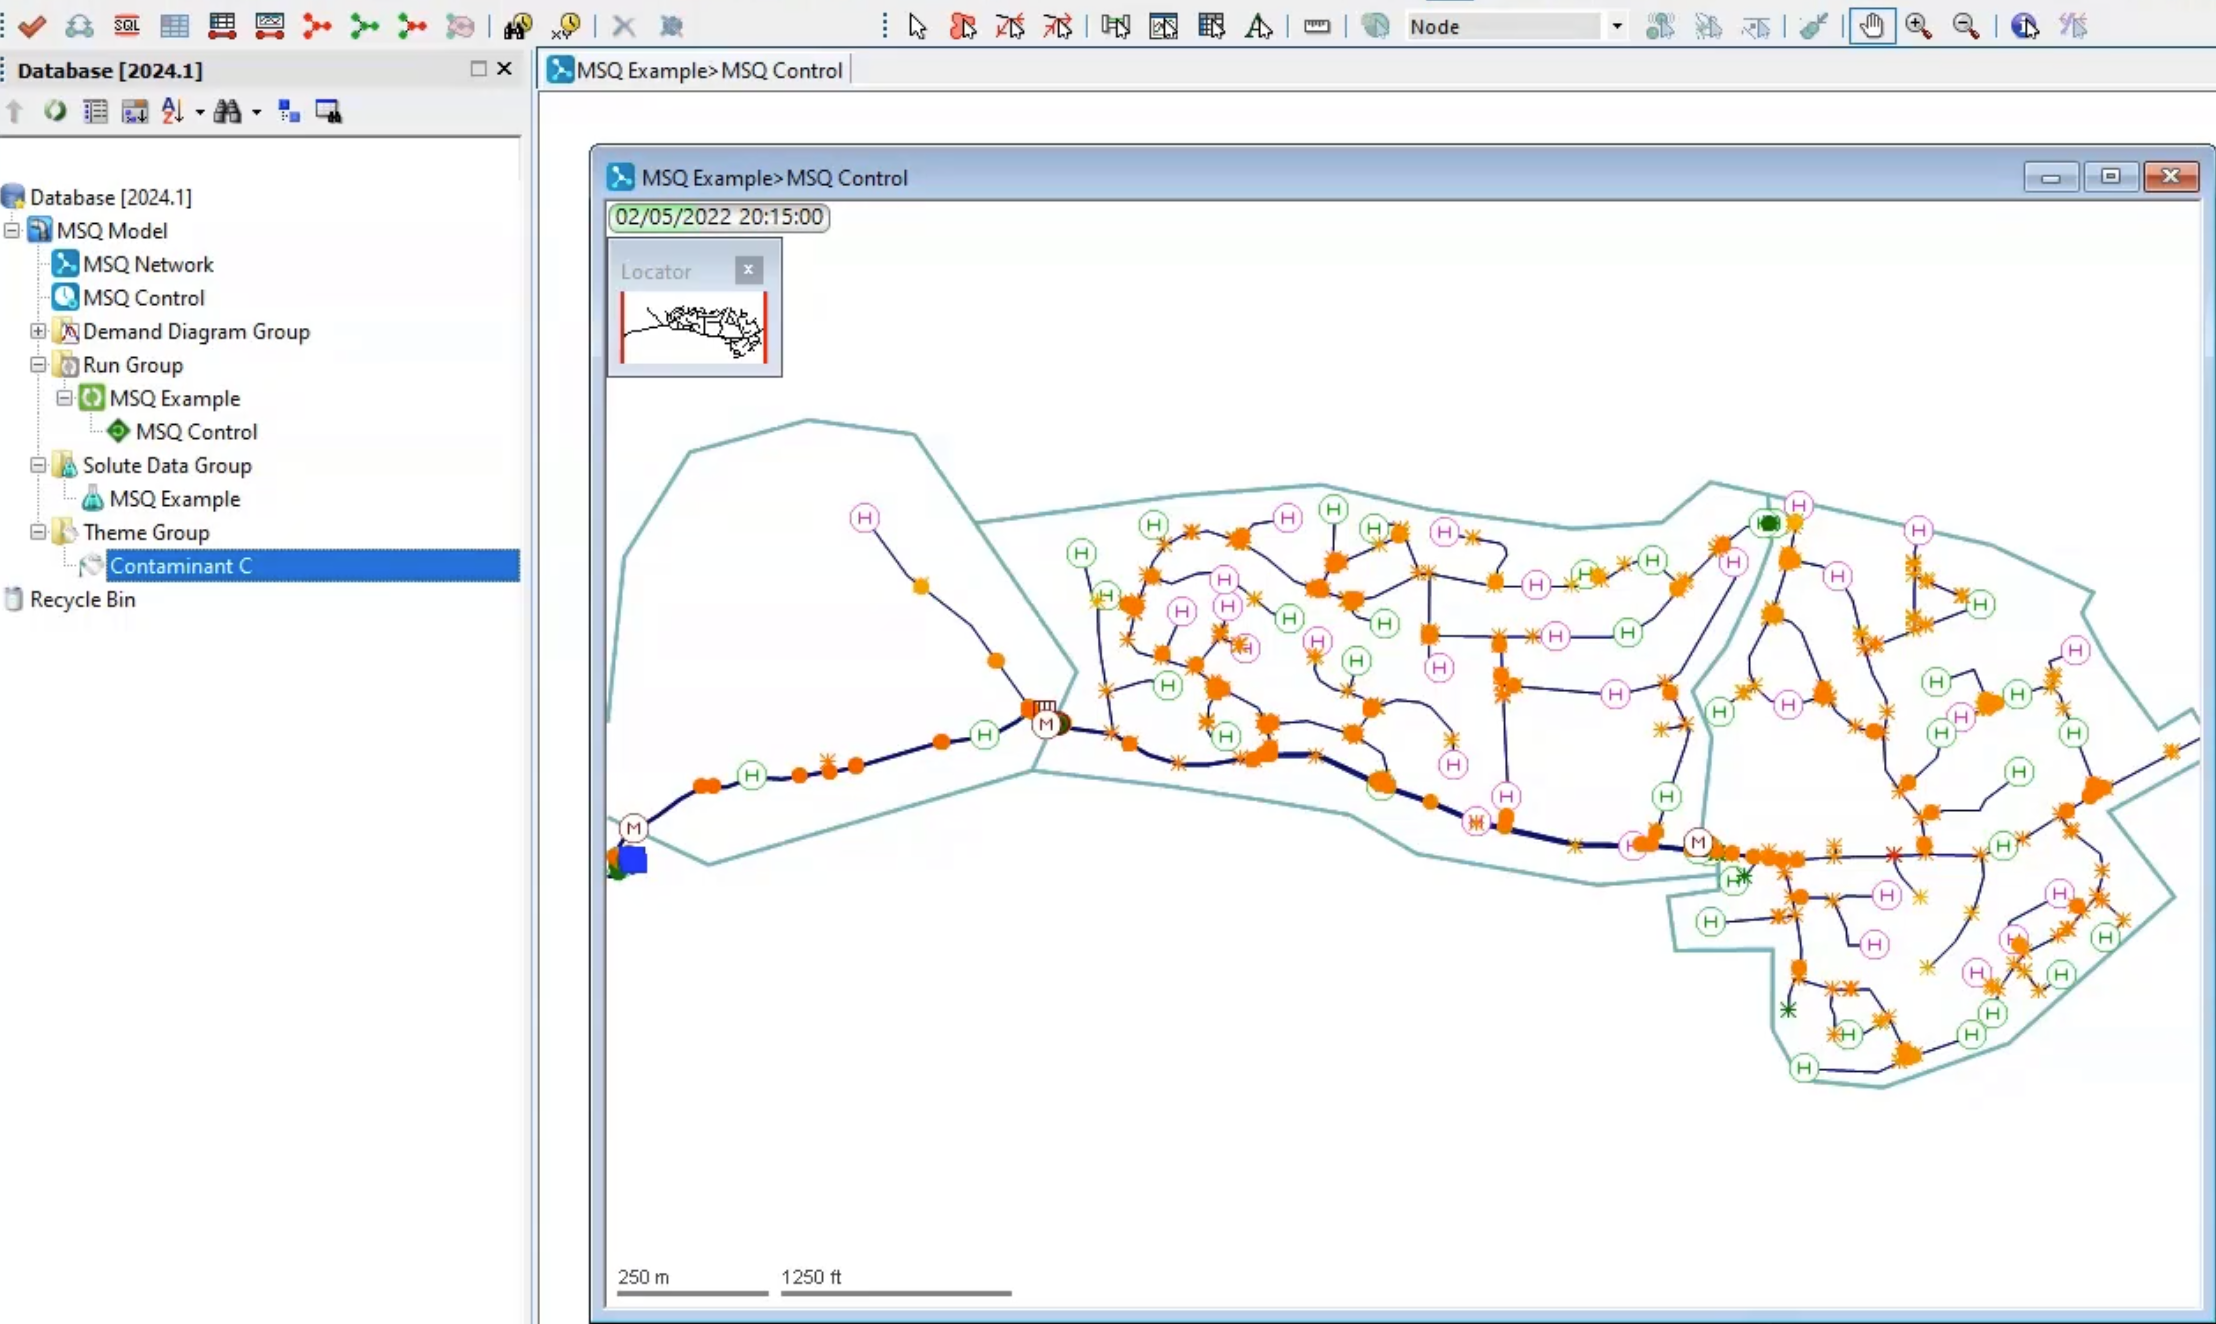
To see how Contaminant A and B react to form Contaminant C across the network:
- Double-click the Contaminant C theme.
- On the Replay toolbar, click Play to start the simulation and visualize the movement of Contaminant C through the network over time.