Exporting summary data
Export summary data.
Tutorial resources
These downloadable resources will be used to complete this tutorial:
Step-by-step Guide
InfoWorks WS Pro allows users to export both time varying data (TVD) and summary data.
Summary data provides a summary of the Time Varying Data, such as maximum, minimum, and average values. This functionality can be useful for exporting large numbers of objects for comparison.
This example exports a summary report of the average, minimum, and maximum pressure values for a selection of customers to CSV.
- Create a new folder with the name “Results” to store the results of this exercise.
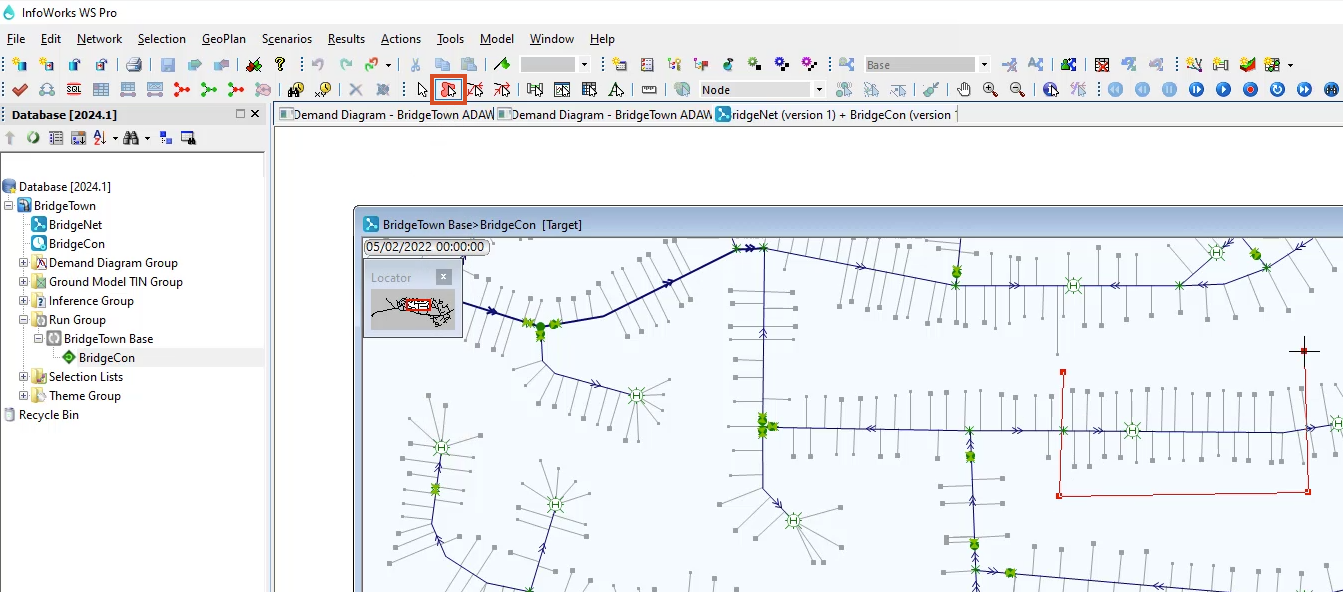
- From the Model Group window, drag-and-drop a completed run with results into the workspace to open the simulation GeoPlan.
- Zoom into a part of the network populated with customer points.
- In the Tools toolbar, click the Polygon select tool.
- Click to draw the vertices of a polygon around several customer points.
Note: The selection may include other objects.
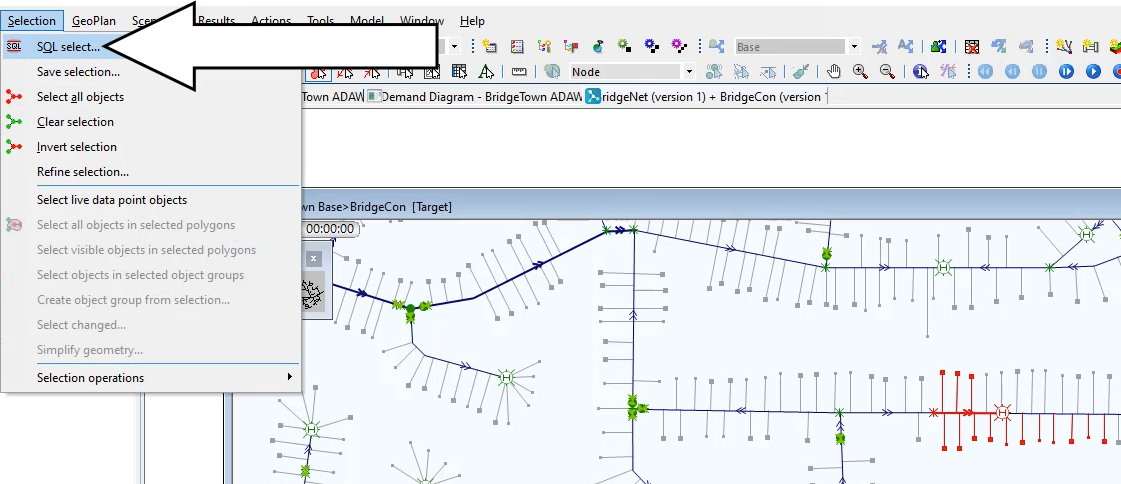
- In the Selection menu, pick SQL Select.
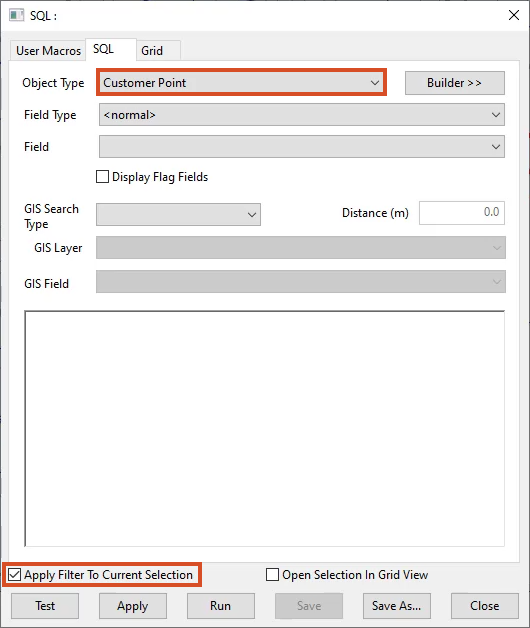
- In the SQL dialog box, expand the Object Type drop-down and select Customer Point.
- Check the box next to Apply Filter to Current Selection.
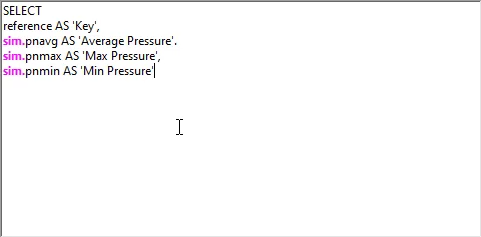
- Enter the following query into the text box:
SELECT
reference AS ‘Key’,
sim.pnavg AS ‘Average Pressure’,
sim.pnmax AS ‘Max Pressure’,
sim.pnmin AS ‘Min Pressure’
- Click the Test button.
- Click OK in the valid syntax notification.
- Click Apply.
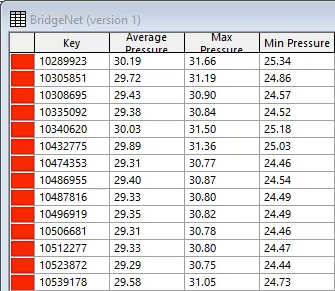
A grid appears displaying the average, minimum, and maximum pressures of all the selected customer points. The contents can be copied and pasted into a spreadsheet.
OR, to Export the contents to a CSV file:
- Close the grid results window.
- In the SQL dialog box, start a new line in the query and type: INTO FILE ”
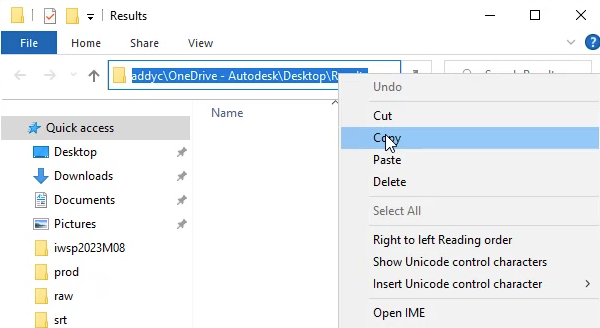
- In a file explorer window, navigate to the Results folder created previously.
- Click the address bar to display the full path of the folder.
- Right-click the path and select Copy.
- In the WS Pro SQL dialog box, press CTRL+V to paste the file path into the query.
- At the end of the query, type: \CustomerResults.csv”
- Click Apply.

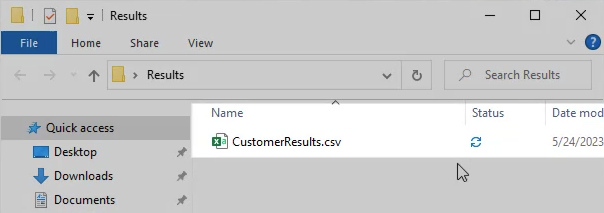
The CustomerResults.csv file now appears in the Results folder and can be opened in a spreadsheet application.