Performing a generalized pipe break assessment
Perform a GMR for a pipe break assessment.
Tutorial resources
These downloadable resources will be used to complete this tutorial:
Step-by-step guide
To simulate a pipe break and assess the results, first configure the GMR to break each pipe one by one. Then, run a simulation for each break.
- Open a network and control in the background.
- In the Model Group window, right-click Generalized Multi Run Group.
- Select New > Generalized Multi Run Config.
- In the New Name dialog box, set the name to “Pipe Break Assessment” for this example.
- Click OK.
A new Generalized Multi Run appears in the Model Group window:
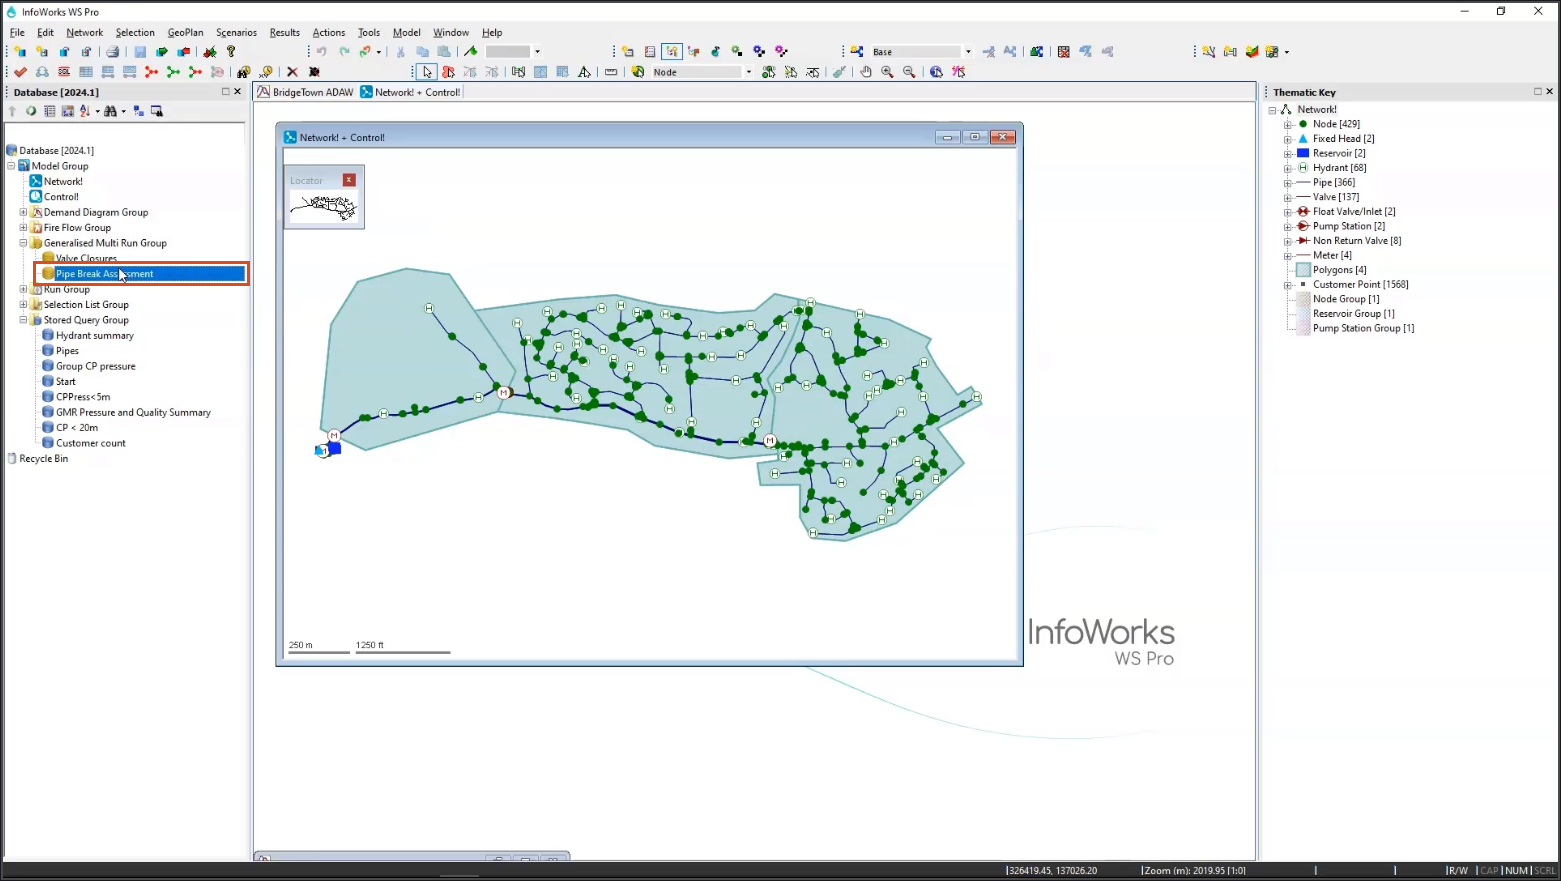
- Double click Pipe Break Assessment to open it.
- Within the Generalized Multi Run Configuration dialog box, navigate to the Test Cases tab.
- From the Model Group, drag and drop the “Pipes” selection list into the Selection List pane.
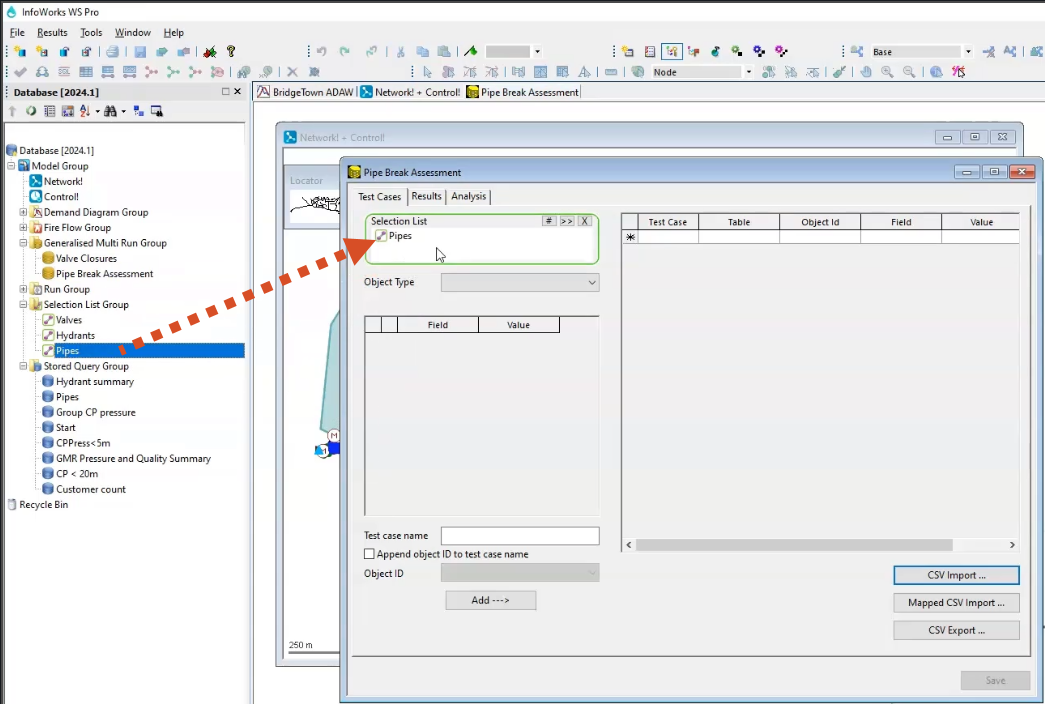
- Expand the Object Type drop-down and select Pipe (Control).
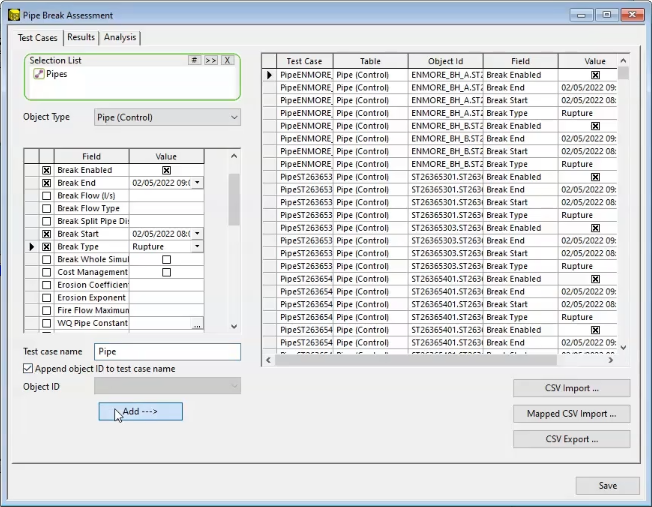
- Then in the grid, scroll down and enable Break Enabled.
- Set the Break Start time to 8:00.
- Set the Break End time to 9:00.
- Set the Break Type to Rupture.
- In the Test case name field, enter a name to be used for all test cases, such as “Pipes” for this example.
- Enable Append object ID to test case name.
- Click Add.
The table populates with the Pipes test cases:
- Click the Results tab.
- Select Keep all TVD results and individual summaries.
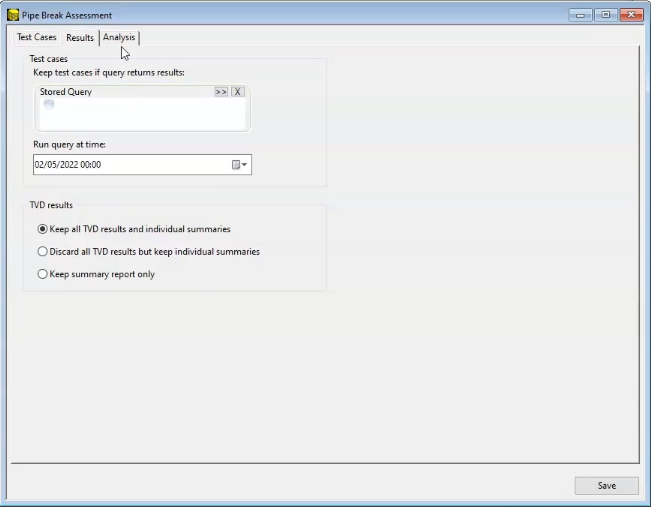
- Click the Analysis tab.
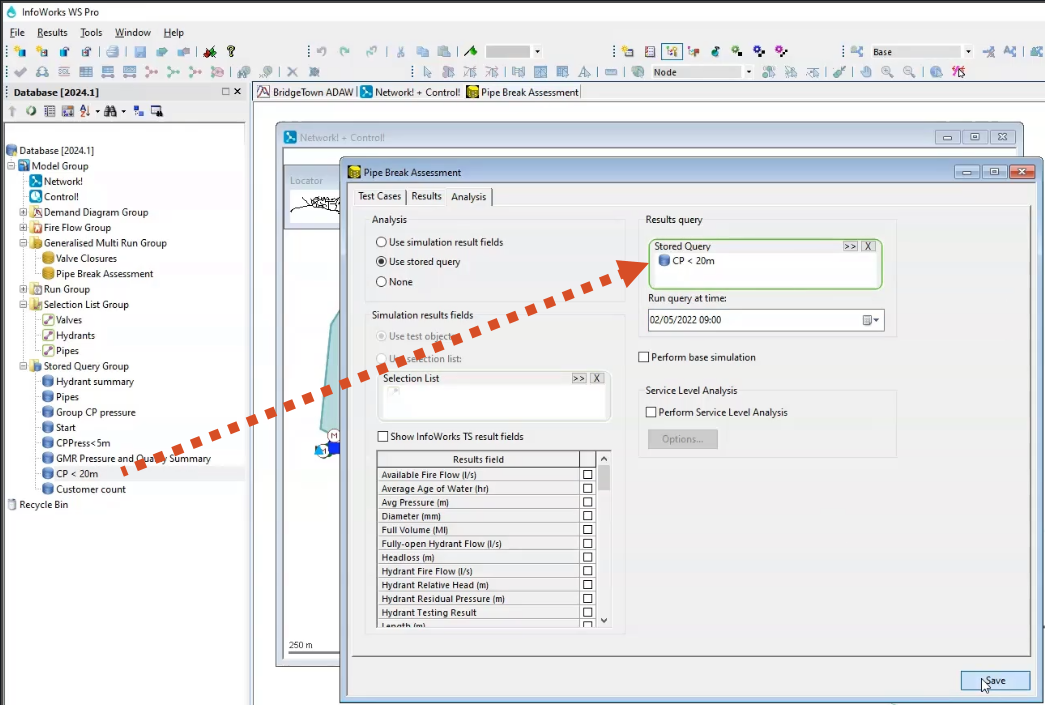
- Select Used Stored Query.
- From the Model Group, expand the Stored Query Group.
- Drag and drop the CP<20m SQL into the Stored Query pane.
- Set the query time to be 02/05/2022 at 9:00.
- Click Save.
- From the Model Group, right-click Run Group.
- Select New > Run.
- In the Schedule Hydraulic Run dialog box, name this run “Pipe Break Assessment”.
- Select Experimental.
- Ensure that the network, control, and demand diagram are assigned, if not already.
- Expand the Run Type drop down.
- Select Normal.
- From the Run Type group, select Generalized Multi Run.
- From the Generalized Multi Run Options dialog box, specify the previously created “Pipe Break Assessment” configuration by dragging it from the Model Group and dropping it into the Configuration pane.
OR, select Browse (>>), navigate to the desired configuration file, select it, and click OK.
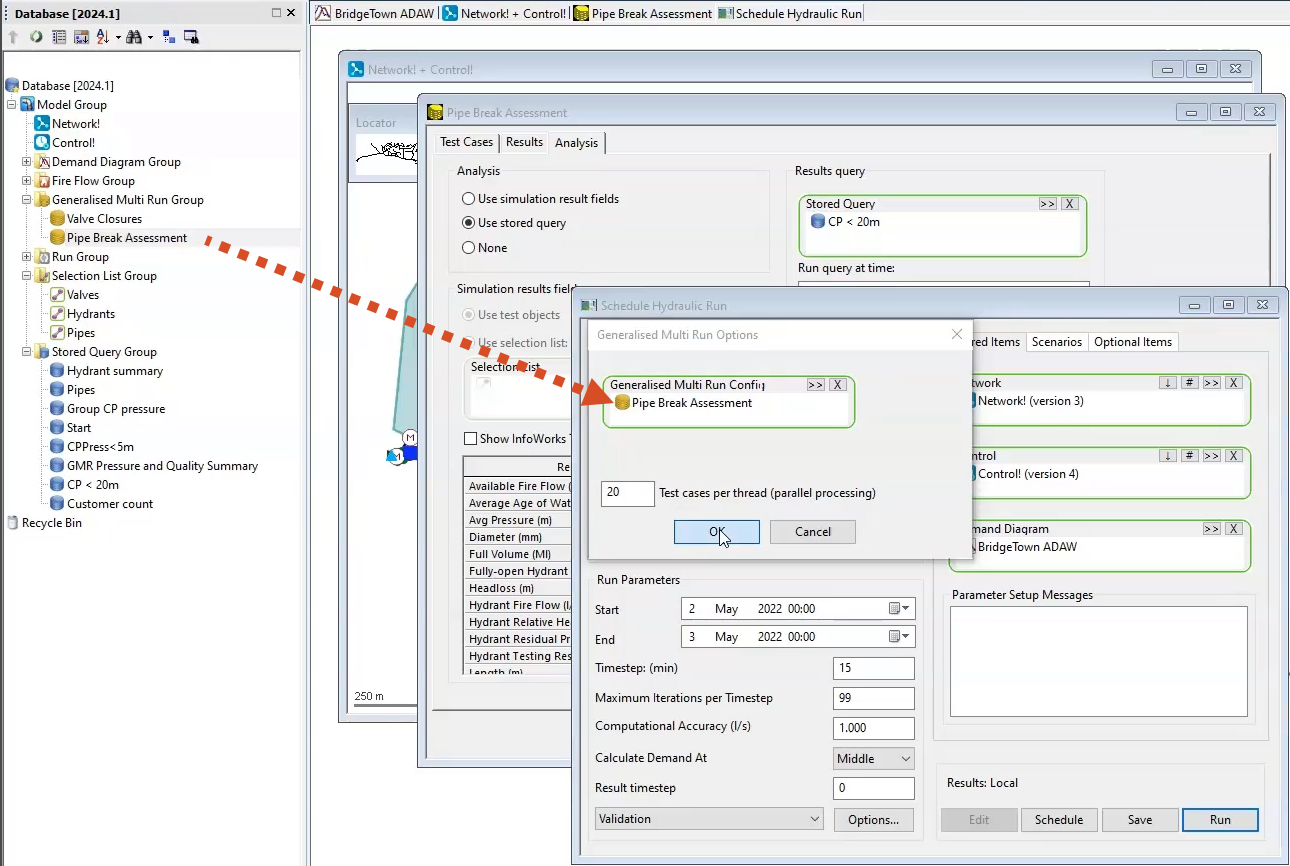
- Click OK.
- Back in the Schedule Hydraulic Run dialog box, click Run.
- Close the Pipe Break Assessment dialog box, if it not already closed.
After a few minutes, the run displays in the Model Group window:
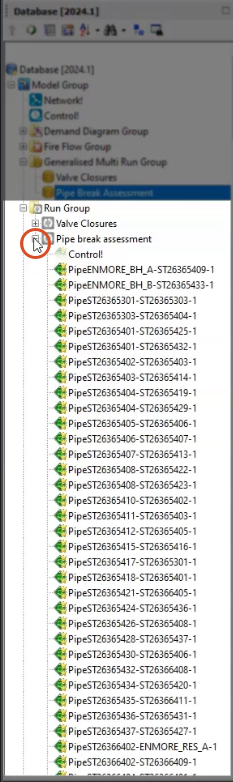
Note: There are a number of simulations present, as well as the summary report. The simulations are those that have met the criteria specified in the stored query.
- Right-click the “Control” simulation.
- Select Open as….
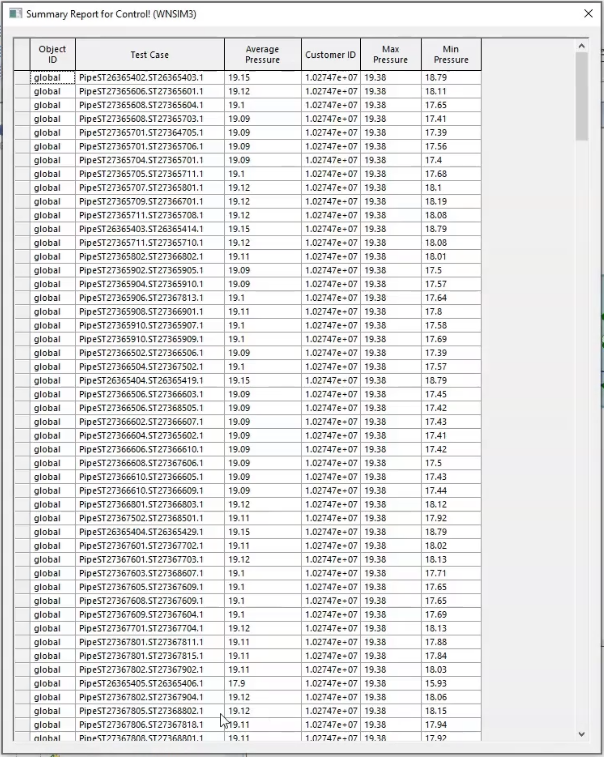
- In the Select Results dialog box, click Summary Report.
- Click OK.
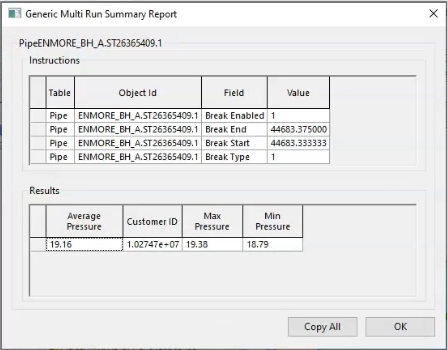
A Summary Report appears that includes a summary of each test case where the maximum pressure is below 20m:
- Close the summary report.
- In the Model Group, right-click one of the test case simulations.
- Select Open as….
- In the Select Results dialog box, click Summary Report.
- Click OK.
- From here, the pipe test can be opened as a summary that is specific to that simulation, or it can be opened as simulation results on the GeoPlan, for theme application and labelling.