& Construction

Integrated BIM tools, including Revit, AutoCAD, and Civil 3D
& Manufacturing

Professional CAD/CAM tools built on Inventor and AutoCAD

Integrated BIM tools, including Revit, AutoCAD, and Civil 3D

Professional CAD/CAM tools built on Inventor and AutoCAD
Add a closed surge tank to affect surge results in your pipe network.
Type:
Tutorial
Length:
5 min.
Tutorial resources
These downloadable resources will be used to complete this tutorial:
Transcript
00:04
In InfoSurge Pro, surge protection devices (SPDs) can help reduce the magnitude of pressure waves
00:11
resulting from transients in a pipe network.
00:15
You can create a surge protection device by selecting a node and changing it to an SPD.
00:22
In this exercise, you set up a closed surge tank,
00:26
and then examine how the tank volume and initial gas volume affect surge results.
00:33
From the Model Explorer, expand the Auxiliary Calculator drop-down menu and select Resistance.
00:42
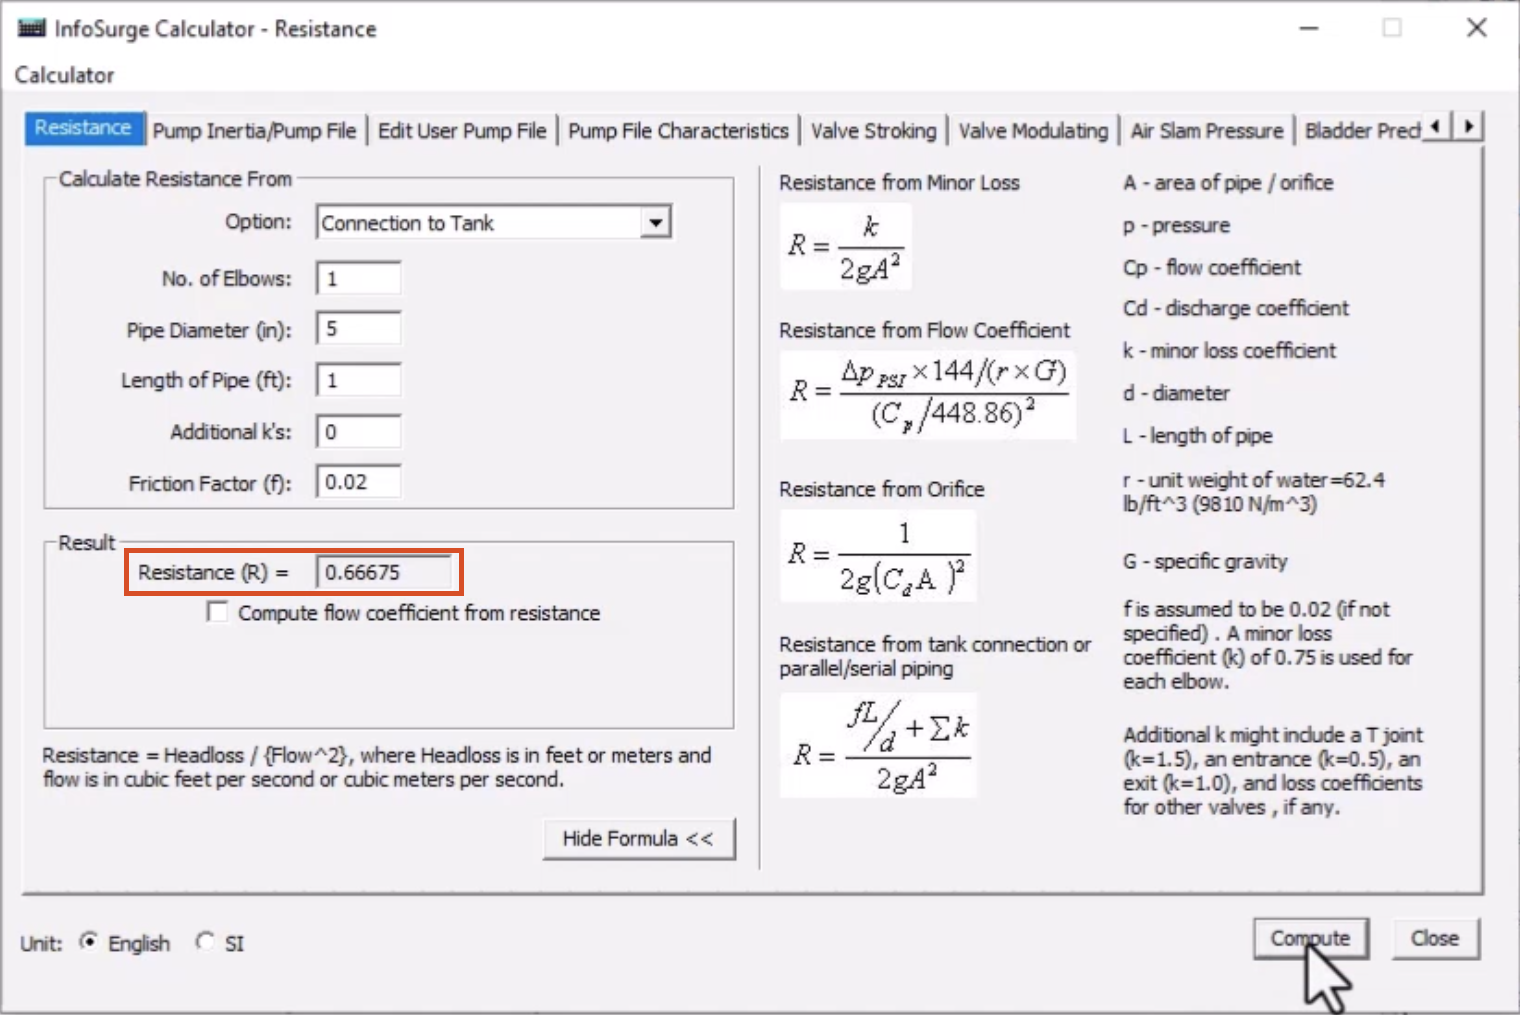
In the InfoSurge Calculator – Resistance dialog, make sure Unit is set to English.
00:50
Then, in the Calculate Resistance From group box,
00:54
from the Option drop-down, select Connection to Tank.
00:59
The list of options in the group box updates.
01:02
Set the following values:
01:05
Set the Number of Elbows to 1.
01:08
Set the Pipe Diameter to 5 inches.
01:12
Assign the Length of Pipe a value of 1 foot.
01:16
Finally, set the Additional k’s to 0.
01:21
The default Friction Factor of 0.02 should be used.
01:27
When finished, click Compute, and then note the resistance, or R value, of the connection to the tank.
01:36
In this example, the R value is 0.66675.
01:43
Click Close.
01:45
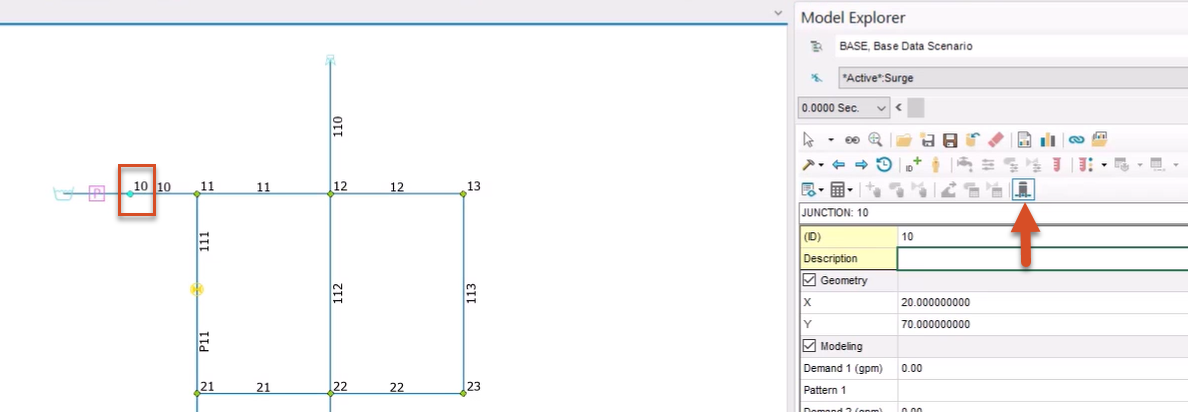
To set up a closed surge tank, from the map, select Junction 10.
01:51
Then, from the Model Explorer, click the Surge Protection Device button.
01:58
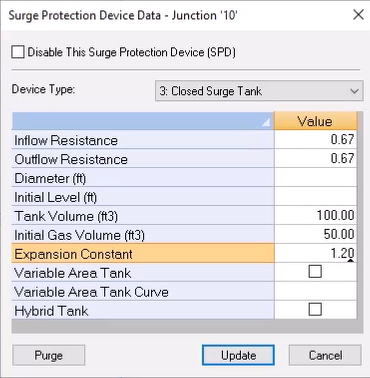
In the Surge Protection Device Data dialog, expand the Device Type drop-down and select 3: Closed Surge Tank.
02:08
Assign the calculated value of 0.67 for both the Inflow and Outflow Resistance values.
02:18
Set the Tank Volume to 100 cubic feet.
02:22
Set the Initial Gas Volume to 50 cubic feet.
02:27
Then, set the Expansion Constant to 1.2.
02:33
Leave all other parameters blank to use their defaults.
02:37
Click Update to save your changes and close the dialog.
02:42
To run a surge analysis with the closed surge tank in place,
02:48
from the Model Explorer, click the Run Manager button.
02:53
In the Run Manager dialog, make sure you have the Surge tab open.
02:59
Click the Run button to run the surge analysis.
03:03
A green traffic light icon displays when the analysis is complete.
03:08
Click OK to close the dialog.
03:12
From the ribbon, View panel, click Report Manager.
03:17
In the Report Manager dialog, click New to open the Output Report/Graph dialog.
03:25
In the Available Output Sources area, select the *Active*:Surge option.
03:32
From the Graph Report tab, pick Surge Node Graph.
03:37
In the Data Scope group box, enable the Selected Element(s) < option, if it is not already.
03:46
Click Open.
03:48
On the map, select Junction 11 to view its pressure profile in the Report Manager dialog.
03:57
Note the maximum, minimum, and average pressure values.
04:02
Close the Report Manager.
04:04
Now, resize the closed surge tank to see how it performs differently.
04:10
Again, select Junction 10 from the map, and then click the Surge Protection Device button.
04:18
Change the Tank Volume to 40, and the Initial Gas Volume to 20.
04:25
Click Update.
04:27
Run another surge analysis.
04:30
Then, open the Report Manager dialog and click Refresh All to populate the newest run data.
04:40
Observe the changes to the pressure values resulting from the smaller tank and initial gas volumes.
04:46
They show that the smaller tank was not as effective as the larger tank in mitigating the pressure surge.
04:54
Feel free to adjust the tank and gas volumes and rerun the analysis to see how the results change.
Video transcript
00:04
In InfoSurge Pro, surge protection devices (SPDs) can help reduce the magnitude of pressure waves
00:11
resulting from transients in a pipe network.
00:15
You can create a surge protection device by selecting a node and changing it to an SPD.
00:22
In this exercise, you set up a closed surge tank,
00:26
and then examine how the tank volume and initial gas volume affect surge results.
00:33
From the Model Explorer, expand the Auxiliary Calculator drop-down menu and select Resistance.
00:42
In the InfoSurge Calculator – Resistance dialog, make sure Unit is set to English.
00:50
Then, in the Calculate Resistance From group box,
00:54
from the Option drop-down, select Connection to Tank.
00:59
The list of options in the group box updates.
01:02
Set the following values:
01:05
Set the Number of Elbows to 1.
01:08
Set the Pipe Diameter to 5 inches.
01:12
Assign the Length of Pipe a value of 1 foot.
01:16
Finally, set the Additional k’s to 0.
01:21
The default Friction Factor of 0.02 should be used.
01:27
When finished, click Compute, and then note the resistance, or R value, of the connection to the tank.
01:36
In this example, the R value is 0.66675.
01:43
Click Close.
01:45
To set up a closed surge tank, from the map, select Junction 10.
01:51
Then, from the Model Explorer, click the Surge Protection Device button.
01:58
In the Surge Protection Device Data dialog, expand the Device Type drop-down and select 3: Closed Surge Tank.
02:08
Assign the calculated value of 0.67 for both the Inflow and Outflow Resistance values.
02:18
Set the Tank Volume to 100 cubic feet.
02:22
Set the Initial Gas Volume to 50 cubic feet.
02:27
Then, set the Expansion Constant to 1.2.
02:33
Leave all other parameters blank to use their defaults.
02:37
Click Update to save your changes and close the dialog.
02:42
To run a surge analysis with the closed surge tank in place,
02:48
from the Model Explorer, click the Run Manager button.
02:53
In the Run Manager dialog, make sure you have the Surge tab open.
02:59
Click the Run button to run the surge analysis.
03:03
A green traffic light icon displays when the analysis is complete.
03:08
Click OK to close the dialog.
03:12
From the ribbon, View panel, click Report Manager.
03:17
In the Report Manager dialog, click New to open the Output Report/Graph dialog.
03:25
In the Available Output Sources area, select the *Active*:Surge option.
03:32
From the Graph Report tab, pick Surge Node Graph.
03:37
In the Data Scope group box, enable the Selected Element(s) < option, if it is not already.
03:46
Click Open.
03:48
On the map, select Junction 11 to view its pressure profile in the Report Manager dialog.
03:57
Note the maximum, minimum, and average pressure values.
04:02
Close the Report Manager.
04:04
Now, resize the closed surge tank to see how it performs differently.
04:10
Again, select Junction 10 from the map, and then click the Surge Protection Device button.
04:18
Change the Tank Volume to 40, and the Initial Gas Volume to 20.
04:25
Click Update.
04:27
Run another surge analysis.
04:30
Then, open the Report Manager dialog and click Refresh All to populate the newest run data.
04:40
Observe the changes to the pressure values resulting from the smaller tank and initial gas volumes.
04:46
They show that the smaller tank was not as effective as the larger tank in mitigating the pressure surge.
04:54
Feel free to adjust the tank and gas volumes and rerun the analysis to see how the results change.
In InfoSurge Pro, surge protection devices (SPDs) can help reduce the magnitude of pressure waves resulting from transients in a pipe network. This example sets up a closed surge tank, and then examines how the tank volume and initial gas volume affect surge results.
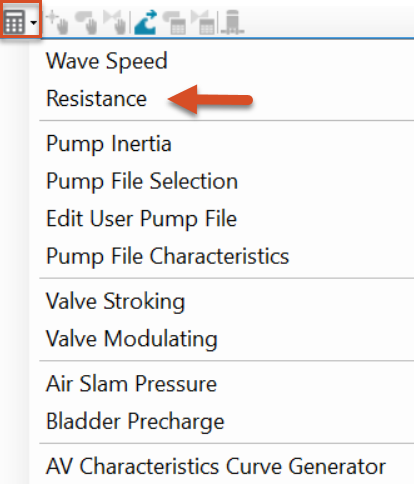
The list of options in the group box updates.
Assign the following values:
Note the resistance, or R value, of the connection to the tank. In this example, the R value is 0.66675.
To set up a closed surge tank:
Set the following values:
Leave all other parameters blank to use their defaults.
To run a surge analysis with the closed surge tank in place:
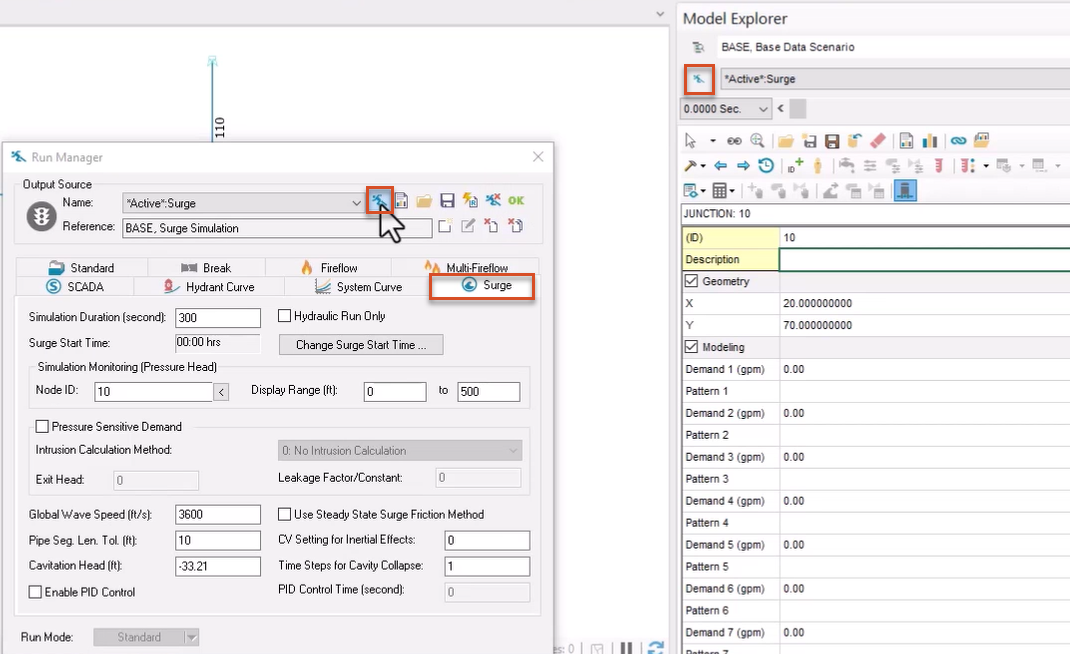
The traffic light icon appears green when the analysis is complete to indicate success.
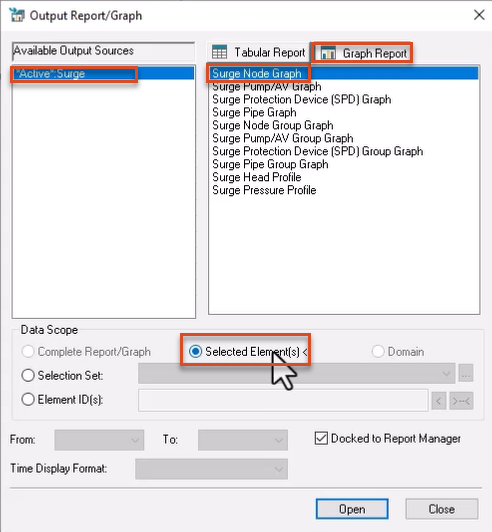
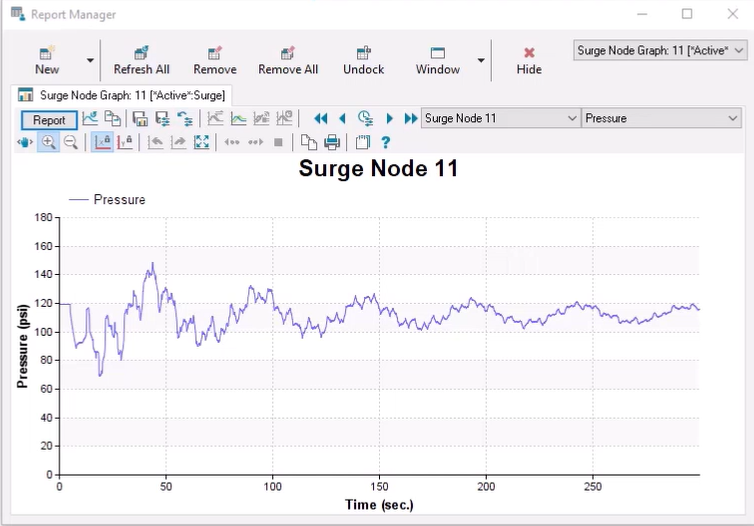
Note the maximum, minimum, and average pressure values.
Now, resize the closed surge tank to see how it performs differently.
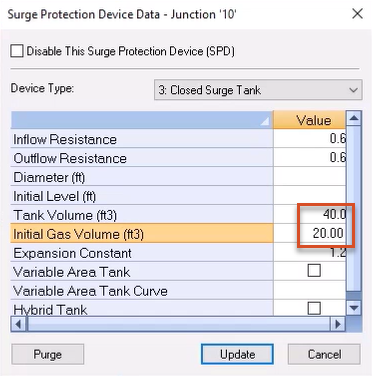
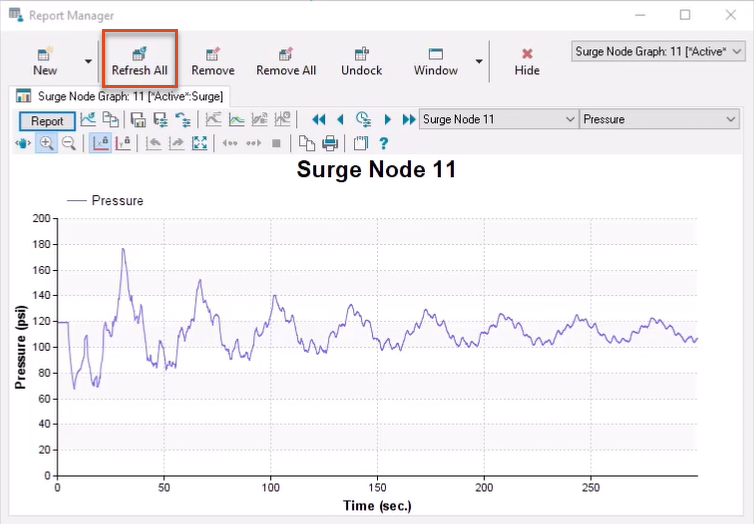
Observe the changes to the pressure values resulting from the smaller tank and initial gas volumes. They show that the smaller tank was not as effective as the larger tank in mitigating the pressure surge.
How to buy
Privacy | Do not sell or share my personal information | Cookie preferences | Report noncompliance | Terms of use | Legal | © 2025 Autodesk Inc. All rights reserved
Sign in for the best experience
Save your progress
Get access to courses
Receive personalized recommendations
May we collect and use your data?
Learn more about the Third Party Services we use and our Privacy Statement.May we collect and use your data to tailor your experience?
Explore the benefits of a customized experience by managing your privacy settings for this site or visit our Privacy Statement to learn more about your options.